• Genel bakış
  • İncelemeler (2)
  • Yorumlar

Self Tuning Envelopes

5

Introduction

MT5 ships with the Envelopes indicator. This indicator allows you to create equidistant bands from a moving average by specifying a “deviation.” Unfortunately, the deviation is an arbitrary number. You might determine that 0.220 works well to contain 95% of close prices for USDCHF,H1, but when you change the period to H4, most of the bars are now outside the bands.

So, I created this self-tuning indicator. Instead of specifying a percent “deviation,” you specify the percent of bars you wish to “poke through” the bands. Using the above example, you could specify that you want 5% of bar closes within 200 bars to poke through the bands. That is:

  • Percent Bars Outside = 5

  • Tuning Method = Close

  • Tuning Period = 200

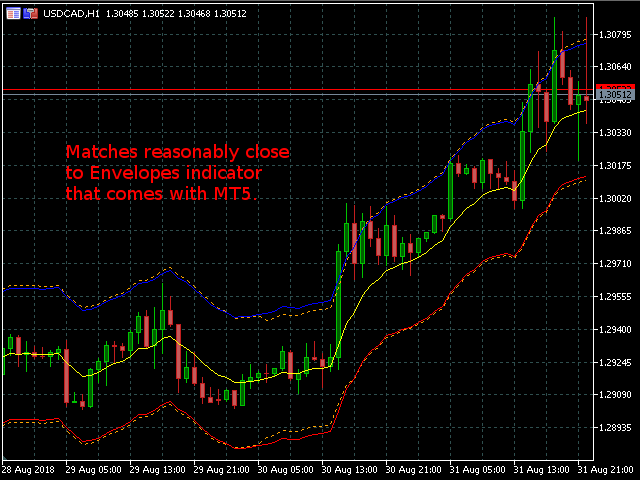
When you switch from H1 to H4, or even to M30, the bands will always contain 95% of closes. You can also switch from EURUSD to GBPJPY without a hitch.

Notes

  • Bands are always equidistant from the center moving average, but bands are not a fixed distance for all bars (as they are with the MT5 Envelopes indicator).

  • The upper and lower band values are calculated from the last “full” bar. That is, bands are not calculated each tick.

  • Upper and Lower band values are not re-painted on the display for new calculations. Once calculated, band values are displayed and not changed. Internal calculations do re-calculate band values when fitting the 5% (example) criterion; however, these internal calculations are not displayed. Just remember: the displayed upper and lower band values are correct only looking into the past, i.e. to the left of the bar in question.

Disclaimers

Mac & Linux

Do not download this product if you have a Mac.

Wine doesn’t support the Market tab. Do not download this product if you do not have a Markets tab in MT5.

Features

  • Auto-tuning on any period or symbol

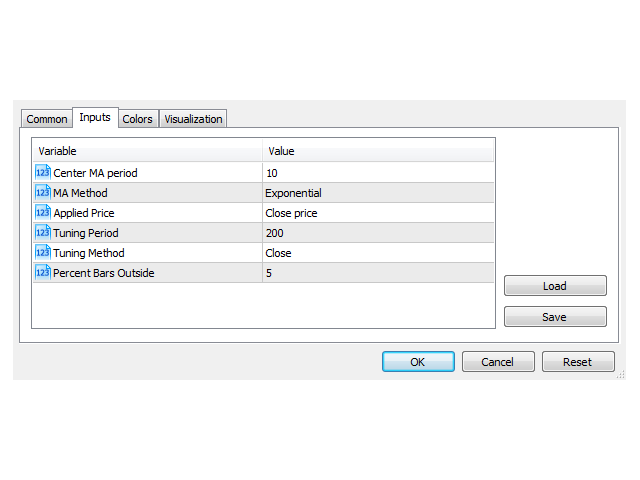
Indicator’s Parameters

Center MA period – This specifies the period of the center moving average, e.g. 10, 12, 14.

MA Method – This specifies the method of the center moving average, e.g. EMA, SMA, etc.

Applied Price – This specifies the Applied Price of the center moving average, e.g. PRICE_CLOSE.

Tuning Period – This specifies the lookback period for tuning. It should be considerably longer than the MA period. I typically use 200; but you could make this value something like 252 (# of trading days in a year) or 120 (# of trading hours within a week). Add multiple versions of this indicator to the same chart, varying this number, to get a sense of what it does. The larger the number, the more calculations are necessary. If speed is a concern, like on an M5 chart, try changing this to 100. Lesser values, like 50, work—but the resulting bands are very different from the MT5 Envelopes indicator.
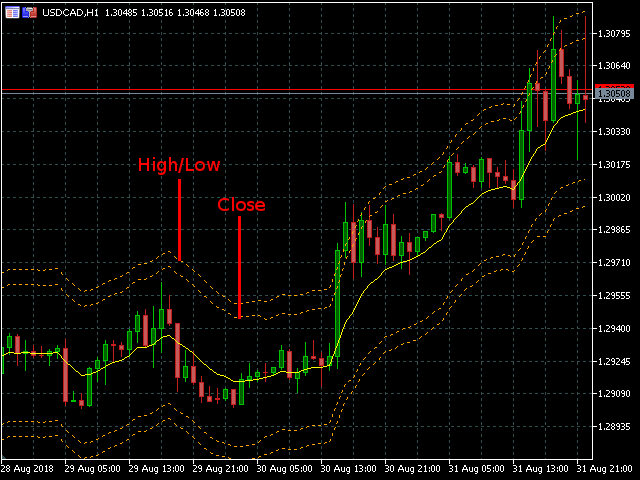
Tuning MethodThis specifies if close or high/low prices are used to determine the percent of bars that poke through the bands.

Percent Bars Outside – Specifies was percent of bars poke through the upper and lower bands based upon the Tuning Method. Obviously, High/Low will have slightly wider bands than Close. I typically use 5% for this.

İncelemeler 2
Bernardo Carvalho
683
Bernardo Carvalho 2023.12.21 13:22 
 

Very good idea thanks

Nicoletto
210
Nicoletto 2021.07.16 14:28 
 

Muy bueno gracias.

Önerilen ürünler
Multi-timeframe trend indicator based on the ADX / ADXWilder indicator with Fibonacci levels The indicator shows trend areas using ADX or ADXWilder indicator data from multiple timeframes. The impulse mode of the indicator allows you to catch the beginning of a trend, and several "Screens" with different timeframes allow you to filter out market noise. Fibonacci levels are added to the price chart, which have flexible settings. How the indicator works: if PDI is greater than NDI, then   it`s
FREE
Bollinger Bands B
Flavio Javier Jarabeck
4.5 (2)
John Bollinger created this indicator in 2010 as a way to read the original indicator (Bollinger Bands) in a more "technical" way, shown as an oscillator. The typical range of the Bollinger Bands %B is 0 - 0.5 - 1.0, where "0" represents the lower band, the "0.5" the middle band, and "1" the upper band. The line on the indicator represents the Closing prices. As simple as that. SETTINGS Bollinger Bands period of analysis Standard Deviation multiplier Shift Price type to be analyzed If you like
FREE
Free automatic Fibonacci is an indicator that automatically plots a Fibonacci retracement based on the number of bars you select on the BarsToScan setting in the indicator. The Fibonacci is automatically updated in real time as new highest and lowest values appears amongst the selected bars. You can select which level values to be displayed in the indicator settings. You can also select the color of the levels thus enabling the trader to be able to attach the indicator several times with differe
FREE
Follow The Line MT5
Oliver Gideon Amofa Appiah
4.52 (29)
This indicator obeys the popular maxim that: "THE TREND IS YOUR FRIEND" It paints a GREEN line for BUY and also paints a RED line for SELL. (you can change the colors). It gives alarms and alerts of all kinds. IT DOES NOT REPAINT and can be used for all currency pairs and timeframes. Yes, as easy and simple as that. Even a newbie can use it to make great and reliable trades. NB: For best results, get my other premium indicators for more powerful and reliable signals. Get them here: https://www.m
FREE
Gösterge, grafikte yuvarlak seviyeleri gösterir. Bunlara psikolojik, banka veya ana oyuncu seviyeleri de denir. Bu seviyelerde boğalar ve ayılar arasında gerçek bir mücadele vardır, birçok emir birikir ve bu da oynaklığın artmasına neden olur. Gösterge, herhangi bir enstrümana ve zaman dilimine otomatik olarak ayarlanır. 80 seviyesi kırılır ve ardından test edilirse, satın alın. 20 seviyesi kırılır ve ardından test edilirse, satış yapın. Hedef 00'dır. Dikkat! Güçlü destek ve direnç seviyeleri n
FREE
This is a regression tree indicator for MT4/MT5. This indicator classificate nodes on the time period so that the deviation becomes smaller, and displays regression line and channel for each node. It's free! Attached CartDemo.ex4 and CartDemo.ex5 is a Demo version and has the following limitations: Can't use HighSpeed method (default method is RandomForest) Maximum number of bars is 260 (increase from 200) There is no expiration date and can be started many times, but it stops after an hour.
FREE
Haven FVG Indicator
Maksim Tarutin
5 (1)
Gösterge   Haven FVG   , piyasaları analiz etmek için bir araçtır ve grafikte verimsizlik alanlarını (Fair Value Gaps, FVG) tanımlamanıza olanak tanır, böylece tüccarlara fiyat analizi ve ticari kararlar almak için anahtar seviyeler sağlar. Diğer ürünler ->  BURADA Ana Özellikler: Bireysel renk ayarları: Alış FVG rengi   (Bullish FVG Color). Satış FVG rengi   (Bearish FVG Color). Esnek FVG görselleştirme: FVG aramak için maksimum mum sayısı. FVG bölgelerinin belirli bir bar sayısı kadar ek uzat
FREE
The indicator identifies when a divergence occurs between price and an indicator or oscillator. It identifies both regular and hidden divergences. Combined with your own rules and techniques, this indicator will allow you to create (or enhance) your own powerful system. Features Can detect divergences for the following oscillators/indicators:   MACD, OsMA, Stochastics, RSI, CCI, RVI, Awesome, ADX, ATR, OBV, Composite index, MFI and Momentum. Only one oscillator/indicator can be selected. Draws
FREE
Are you tired of drawing trendlines every time you're analyzing charts? Or perhaps you would like more consistency in your technical analysis. Then this is for you. This indicator will draw trend lines automatically when dropped on a chart. How it works Works similar to standard deviation channel found on mt4 and mt5. It has 2 parameters: 1. Starting Bar 2. Number of bars for calculation The   starting bar   is the bar which drawing of the trend lines will begin, while the   number of bars for c
FREE
Important Lines
Terence Gronowski
4.86 (21)
This indicator displays Pivot-Lines, preday high and low, preday close and the minimum and maximum of the previous hour. You just have to put this single indicator to the chart to have all these important lines, no need to setup many single indicators. Why certain lines are important Preday high and low : These are watched by traders who trade in a daily chart. Very often, if price climbs over or falls under a preday low/high there is an acceleration in buying/selling. It is a breakout out of a
FREE
Special offer : ALL TOOLS , just $35 each! New tools   will be   $30   for the   first week   or the   first 3 purchases !  Trading Tools Channel on MQL5 : Join my MQL5 channel to update the latest news from me Dinamik finansal piyasalarda, trend dönüş sinyallerini tanımlamak etkili ticaret için esastır. RSI Divergence Scanner, çeşitli döviz çiftleri ve zaman dilimleri üzerinde RSI diverjans sinyallerini doğru ve verimli bir şekilde tespit etmenize yardımcı olmak için tasarlanmıştır. Daha fazla
FREE
Value Chart Candlesticks
Flavio Javier Jarabeck
4.73 (11)
The idea of a Value Chart indicator was presented in the very good book I read back in 2020 , " Dynamic Trading Indicators: Winning with Value Charts and Price Action Profile ", from the authors Mark Helweg and David Stendahl. The idea is simple and the result is pure genius: Present candlestick Price analysis in a detrended way! HOW TO READ THIS INDICATOR Look for Overbought and Oversold levels. Of course, you will need to test the settings a lot to find the "correct" one for your approach. It
FREE
Indicator and Expert Adviser  EA Available in the comments section of this product. Download with Indicator must have indicator installed for EA to work. Mt5 indicator alerts for bollinger band and envelope extremes occurring at the same time. Buy signal alerts occur when A bullish candle has formed below both the lower bollinger band and the lower envelope  Bar must open and close below both these indicators. Sell signal occur when A bear bar is formed above the upper bollinger band and upper
FREE
Special offer : ALL TOOLS , just $35 each! New tools   will be   $30   for the   first week   or the   first 3 purchases !  Trading Tools Channel on MQL5 : Join my MQL5 channel to update the latest news from me Supertrend Fakeout Göstergesi, klasik Supertrend göstergesinin geliştirilmiş bir versiyonudur ve daha güvenilir trend sinyalleri sunmak için tasarlanmıştır. Fakeout Index Limit ve Fakeout ATR Mult gibi gelişmiş özellikler sayesinde, bu gösterge kısa vadeli fiyat dalgalanmaları veya piyas
FREE
This indicator is based on the Bollinger Bands indicator. It helps the user identifying whether to buy or sell. It comes with an alert that will sound whenever a new signal appears. It also features an email facility. Your email address and SMTP Server settings should be specified in the settings window of the "Mailbox" tab in your MetaTrader 5. Blue arrow up = Buy. Red arrow down = Sell. Line = Trailing Stop. You can use one of my Trailing Stop products that automatically move the Stop Loss and
FREE
Heiken Ashi MT5 Göstergesi Heiken Ashi MT5 Göstergesi, standart fiyat verilerini daha yumuşak ve trend odaklı mumlara dönüştürerek, piyasa trendlerini ve potansiyel dönüş noktalarını daha kolay belirlemenizi sağlayan güçlü bir araçtır. Ana Özellikler: Net trend tanımlama: Yükseliş ve düşüş trendlerini farklı mum renkleriyle görsel olarak ayırt eder. Gürültü azaltma: Fiyat dalgalanmalarını filtreleyerek piyasanın ana hareketlerine daha net odaklanmanızı sağlar. Erken trend tespiti: Standart graf
FREE
This indicator is a zero-lag indicator and displays  strength of trend change . True Trend  Oscillator Pro works best in combination with True Trend Moving Average Pro that displays exact trend as is. Oscillator value is exact price change in given direction of the trend. True Trend Moving Average Pro: https://www.mql5.com/en/market/product/103586 If you set PERIOD input parameter to 1 this indicator becomes a sharpshooter for binary options. Developers can use True Trend Oscillator in Exper
FREE
这是一个组合指标分析趋势、支撑阻力、买卖点。运用了均线MA、布林带、KDJ、CCI、RSI。 主图上下线是布林带上下线,采用的是20周期和2.3标准差可以用来支撑阻力。 中间的是分析趋势的均线,趋势分析是用均线多周期: 为涨趋势,反之为下跌趋势。在同一种颜色,基本说明趋势没有发生变化。 子图是由   KDJ、CCI、RSI三个指标组成,大于70超买,小于30超卖, 智能提示是运用了算法,主要计算布林带,   KDJ、CCI、RSI指标 有三个或四个指标超出市场常态就会发出提示行情可能反转。 子图指标运用了很多数据,刚刚开始加载会有点慢,耐心等待就可以 这个指标是子图指标,还要再下我发布的MMB分析,这样就刚刚好组成一套分析 电脑分辨率的文本大小请设置100%,不然字体会不一样
FREE
这是一个组合指标分析趋势、支撑阻力、买卖点。运用了均线MA、布林带、KDJ、CCI、RSI。 主图上下线是布林带上下线,采用的是20周期和2.3标准差可以用来支撑阻力。 中间的是分析趋势的均线,趋势分析是用均线多周期: 为涨趋势,反之为下跌趋势。在同一种颜色,基本说明趋势没有发生变化。 子图是由 KDJ、CCI、RSI三个指标组成,大于70超买,小于30超卖, 智能提示是运用了算法,主要计算布林带, KDJ、CCI、RSI指标 有三个或四个指标超出市场常态就会发出提示行情可能反转。 子图指标运用了很多数据,刚刚开始加载会有点慢,耐心等待就可以 这个指标是主图指标,还要再下我发布的RCD分析,这样就刚刚好组成一套分析 电脑分辨率的文本大小请设置100%,不然字体会不一样
FREE
If you are (or were) a fan of the RSI indicator will love Tushar Chande's Dynamic Momentum Index indicator, that simply put is a dynamic variable lenght RSI, so it is more powerful. The DMI indicator internally uses a variable number of bars in its calculations, taking into consideration the volatility levels of the current market you are analyzing. This way, the DMI indicator will use more bars as volatility decreases and less bars when volatility increases, giving you a more powerfull analysis
FREE
Forex Indicator Arrows
Nguyen Nghiem Duy
1 (1)
Forex Indicator Arrows is an arrow Indicator used as an assistant tool for your trading strategy. The indicator analyzes the standard deviation of bar close for a given period and generates a buy or sell signals if the deviation increases. It good to combo with Martingale EA to follow Trend and Sellect Buy Only/Sell Only for EA work Semi-Automatic. You can use this  Indicator with any EAs in my Products.
FREE
High Low Open Close
Alexandre Borela
4.98 (43)
Bu projeyi seviyorsanız, 5 yıldız incelemesi bırakın. Bu gösterge açık, yüksek, düşük ve belirtilen fiyatlar için çizer Dönem ve belirli bir zaman bölgesi için ayarlanabilir. Bunlar birçok kurumsal ve profesyonel tarafından görünen önemli seviyelerdir. tüccarlar ve daha fazla olabileceği yerleri bilmeniz için yararlı olabilir Aktif. Mevcut dönemler şunlardır: Önceki gün. Önceki Hafta. Önceki Ay. Previous Quarter. Önceki yıl. Veya: Mevcut gün. Hafta. Şimdi Ay. Şimdiki Mahallesi. Bugün yıl.
FREE
Peak Trough Analysis is the great tool to detect peaks and troughs in your chart. Peak Trough Analysis tool can use three different peaks and troughs detection algorithm. The three algorithm include the orignal Fractals Indicator by Bill Williams, the Modified Fractals indicator and ZigZag indicator. You can use this peak and trough analysis tool to detect the price pattern made up from Equilibrium Fractal-Wave process. For further usage, there are good guide line on how to use this peak trough
FREE
Best Wave
Vladimir Gotsulenko
3.5 (4)
The indicator of trend (flat) with a price channel. Trading Buy - the price have crossed the central line upwards (the candlestick has closed above the line) and the channel is oriented horizontally (yellow line) or directed upwards(green line). Move to breakeven when reaching the opposite border of the channel. Close positions when conditions for selling are formed. Sell - the price have crossed the central line downwards (the candlestick has closed below the line) and the channel is oriented
FREE
Bollinger Bands Technical Indicator (BB) is similar to envelopes. The only difference is that the bands of Envelopes are plotted a fixed distance (%) away from the moving average, while the Bollinger Bands are plotted a certain number of standard deviations away from it. Standard deviation is a measure of volatility, therefore Bollinger Bands adjust themselves to the market conditions. When the markets become more volatile, the bands widen and they contract during less volatile periods. This ada
FREE
The indicator highlights the points that a professional trader sees in ordinary indicators. VisualVol visually displays different volatility indicators on a single scale and a common align. Highlights the excess of volume indicators in color. At the same time, Tick and Real Volume, Actual range, ATR, candle size and return (open-close difference) can be displayed. Thanks to VisualVol, you will see the market periods and the right time for different trading operations. This version is intended f
FREE
TrailingStop MA
Andrej Nikitin
3.5 (2)
The indicator draws two simple moving averages using High and Low prices. The MA_High line is displayed when the moving average is directed downwards. It can be used for setting a stop order for a sell position. The MA_Low line is displayed when the moving average is directed upwards. It can be used for setting a stop order for a buy position. The indicator is used in the TrailingStop Expert Advisor. Parameters Period - period of calculation of the moving average. Deviation - rate of convergence
FREE
FVG Indicator
Daniel Moises Pimentel Flores
This indicator identifies and highlights market inefficiencies, known as Fair Value Gaps (FVG), on price charts. Using a custom algorithm, the indicator detects these areas of imbalance where the price moves sharply, creating potential trading opportunities. Indicator Parameters: Bullish FVG Color (clrBlue) : Color used to highlight bullish inefficiencies. The default value is blue. Bearish FVG Color (clrRed) : Color used to highlight bearish inefficiencies. The default value is red. Bullish FVG
FREE
ZigZag Support Resistance
Emmanuel Tshepang Mosweu
5 (3)
This indicator uses the Zigzag indicator to identify swing highs and swing lows in the price chart.  Once it has identified the swing highs and swing lows, it can use them to determine potential support and resistance levels. A support level is formed when the price drops and bounces back up from a swing low, indicating that there is buying pressure at that level. A resistance level is formed when the price rises and reverses downward from a swing high, suggesting selling pressure at that level.
FREE
Trend indicator based on the ADX / ADXWilder indicator The indicator shows trend areas using ADX or ADXWilder indicator data. How the indicator works: if PDI is greater than NDI, then it`s bullish movement; if PDI is less than NDI, then it`s bearish movement; if ADX is less than or equal to the filter value specified in the parameters, then there is no movement state. Input parameters of the indicator: Calculate Timeframe - timeframe for calculation; ADX Type - type of ADX calculation based
FREE
Bu ürünün alıcıları ayrıca şunları da satın alıyor
Trend Screener Pro MT5
STE S.S.COMPANY
4.85 (80)
Trend Göstergesi, Trend Alım Satım ve Filtreleme için Çığır Açan Benzersiz Çözüm, Tüm Önemli Trend Özellikleriyle Tek Bir Araç İçinde Yerleştirildi! Forex, emtialar, kripto para birimleri, endeksler ve hisse senetleri gibi tüm sembollerde/araçlarda kullanılabilen %100 yeniden boyamayan çoklu zaman çerçevesi ve Çoklu para birimi göstergesidir. Trend Screener, grafikte noktalarla ok trend sinyalleri sağlayan etkili bir trend trend göstergesidir. Trend analizörü göstergesinde bulunan özellikler: 1.
Algo Pumping
Ihor Otkydach
5 (7)
PUMPING STATION – Kişisel “her şey dahil” stratejiniz Karşınızda PUMPING STATION — forex dünyasında işlem yapma şeklinizi heyecan verici ve etkili bir sürece dönüştürecek devrim niteliğinde bir gösterge. Bu sadece bir yardımcı değil, güçlü algoritmalarla donatılmış tam teşekküllü bir ticaret sistemidir ve daha istikrarlı işlem yapmanıza yardımcı olur. Bu ürünü satın aldığınızda ŞUNLARI ÜCRETSİZ olarak alırsınız: Özel ayar dosyaları: Otomatik kurulum ve maksimum performans için. Adım adım video e
MONEYTRON – ТВОЙ ЛИЧНЫЙ СИГНАЛ НА УСПЕХ! XAUUSD | AUDUSD | USDJPY | BTCUSD Поддержка таймфреймов: M5, M15, M30, H1 Почему трейдеры выбирают Moneytron? 82% успешных сделок — это не просто цифры, это результат продуманной логики, точного алгоритма и настоящей силы анализа. Автоматические сигналы на вход — не нужно гадать: когда покупать, когда продавать. 3 уровня Take Profit — ты сам выбираешь свой уровень прибыли: безопасный, уверенный или максимум. Четкий Stop Loss — контролируешь риск
Golden Trend Indicator MT5
Noha Mohamed Fathy Younes Badr
4.89 (18)
Golden Trend indicator  is The best indicator for predicting trend movement this indicator never lags and never repaints and never back paints    and give  arrow buy and sell    before the candle appear  and it will help you and  will make your trading decisions clearer its work on all currencies and  gold and crypto and all time frame This unique  indicator uses very secret algorithms to catch the  trends, so you can trade using this indicator and see the trend clear on charts  manual guide and
Gold Stuff mt5
Vasiliy Strukov
4.93 (178)
Gold Stuff mt5, özellikle altın için tasarlanmış bir trend göstergesidir ve herhangi bir finansal enstrümanda da kullanılabilir. Gösterge yeniden çizilmez ve gecikmez. Önerilen zaman dilimi H1. Ayarları ve kişisel bir bonusu almak için satın alma işleminden hemen sonra benimle iletişime geçin!  Güçlü Destek ve Trend Tarayıcı göstergemizin ücretsiz bir kopyasını pm'den alabilirsiniz. Ben!   AYARLAR Ok Çiz - açık kapalı. grafik üzerinde oklar çizmek. Uyarılar - sesli uyarılar kapalı. E-posta b
Quantum TrendPulse
Bogdan Ion Puscasu
5 (13)
SuperTrend   ,   RSI   ve   Stochastic'in   gücünü tek bir kapsamlı göstergede birleştirerek işlem potansiyelinizi en üst düzeye çıkaran nihai işlem aracı olan   Quantum TrendPulse'u   tanıtıyoruz. Hassasiyet ve verimlilik arayan yatırımcılar için tasarlanan bu gösterge, piyasa trendlerini, momentum değişimlerini ve en uygun giriş ve çıkış noktalarını güvenle belirlemenize yardımcı olur. Temel Özellikler: SuperTrend Entegrasyonu:   Güncel piyasa trendlerini kolayca takip edin ve karlılık dalgası
Size mükemmel bir teknik gösterge olan Grabber’ı tanıtıyorum. Bu araç, kullanıma hazır bir “her şey dahil” işlem stratejisi olarak çalışır. Tek bir yazılım kodu içinde güçlü piyasa teknik analiz araçları, işlem sinyalleri (oklar), uyarı işlevleri ve push bildirimleri entegre edilmiştir. Bu göstergeyi satın alan herkes aşağıdaki hediyeleri ücretsiz olarak alır: Açık emirleri otomatik yönetmek için Grabber Yardımcı Aracı Kurulum, yapılandırma ve nasıl işlem yapılacağını adım adım anlatan video kıl
FX Power MT5 NG
Daniel Stein
5 (14)
FX Power: Daha Akıllı Ticaret Kararları için Para Birimlerinin Gücünü Analiz Edin Genel Bakış FX Power , her piyasa koşulunda başlıca para birimlerinin ve altının gerçek gücünü anlamak için vazgeçilmez bir araçtır. Güçlü para birimlerini alıp zayıf olanları satarak, FX Power ticaret kararlarınızı basitleştirir ve yüksek olasılıklı fırsatları ortaya çıkarır. İster trendlere sadık kalın ister Delta'nın aşırı değerlerini kullanarak tersine dönüşleri öngörün, bu araç ticaret tarzınıza mükemmel bir
FX Volume MT5
Daniel Stein
4.82 (17)
FX Volume: Bir Broker’ın Perspektifinden Gerçek Piyasa Duyarlılığını Deneyimleyin Kısa Özet Trading yaklaşımınızı bir adım öteye taşımak ister misiniz? FX Volume , perakende traderlar ile brokerların nasıl konumlandığını gerçek zamanlı olarak sunar—COT gibi gecikmeli raporlardan çok daha önce. İster istikrarlı kazançları hedefliyor olun, ister piyasada daha güçlü bir avantaj arayın, FX Volume önemli dengesizlikleri belirlemenize, kırılmaları (breakout) doğrulamanıza ve risk yönetiminizi iyileş
Support And Resistance Screener, MetaTrader için tek bir gösterge içinde birden fazla araç sağlayan tek bir Düzey göstergesindedir. Kullanılabilir araçlar şunlardır: 1. Piyasa Yapısı Eleme Aracı. 2. Geri Çekilme Bölgesi Boğa. 3. Geri Çekilme Bölgesi Ayı. 4. Günlük Pivot Noktaları 5. haftalık Pivot Noktaları 6. aylık Pivot Puanları 7. Harmonik Modele ve hacme dayalı Güçlü Destek ve Direnç. 8. Banka Seviyesi Bölgeleri. SINIRLI SÜRELİ TEKLİF : YG Destek ve Direnç Göstergesi sadece 50 $ ve ömür boyu
Matrix Arrow Indicator MT5
Juvenille Emperor Limited
5 (13)
Matrix Arrow Indicator MT5 ,   forex ,   emtialar ,   kripto   para birimleri ,   endeksler ,   hisse senetleri   gibi tüm sembollerde/araçlarda kullanılabilen   %100 yeniden boyamayan   çoklu zaman çerçevesi göstergesini izleyen benzersiz bir 10'u 1 arada trenddir.  Matrix Arrow Indicator MT5 , mevcut eğilimi erken aşamalarında belirleyecek ve aşağıdakiler gibi 10'a kadar standart göstergeden bilgi ve veri toplayacaktır: Ortalama Yönlü Hareket Endeksi (ADX) Emtia Kanal Endeksi (CCI) Klasik Hei
FourAverageMT5
Mikhail Sergeev
5 (2)
FourAverage, trend tespitinde yeni bir kelimedir. Bilgi teknolojilerinin ve çok sayıda katılımcının gelişmesiyle birlikte, finansal piyasalar modası geçmiş göstergelerle giderek daha az analiz edilebilir hale geliyor. Hareketli Ortalama veya Stokastik gibi olağan teknik analiz araçları, en saf haliyle trendin yönlerini veya tersine dönmesini belirleyemez. Bir gösterge, parametrelerini değiştirmeden 14 yıllık bir geçmişe göre gelecekteki fiyatın doğru yönünü gösterebilir mi? Aynı zamanda, piyasan
FX Levels MT5
Daniel Stein
5 (4)
FX Levels: Tüm Piyasalar İçin Son Derece Hassas Destek ve Direnç Hızlı Bakış Döviz kurları, endeksler, hisseler veya emtialar gibi herhangi bir piyasada güvenilir destek ve direnç seviyeleri belirlemek mi istiyorsunuz? FX Levels geleneksel “Lighthouse” yöntemini ileri düzey bir dinamik yaklaşımla birleştirerek neredeyse evrensel bir doğruluk sağlar. Gerçek broker deneyimimize ve otomatik günlük güncellemeler ile gerçek zamanlı güncellemelerin birleşimine dayalı olarak, FX Levels size dönüş nok
TPSproTREND PrO MT5
Roman Podpora
4.72 (18)
VERSION MT4        —        ИНСТРУКЦИЯ RUS           —        INSTRUCTIONS  ENG Ana işlevler: VERME OLMADAN doğru giriş sinyalleri! Bir sinyal belirirse, alakalı kalır! Bu, bir sinyal sağlayıp daha sonra onu değiştirebilen ve mevduatta fon kaybına yol açabilen yeniden çekme göstergelerinden önemli bir farktır. Artık pazara daha büyük bir olasılık ve doğrulukla girebilirsiniz. Ayrıca, ok göründükten sonra hedefe ulaşılıncaya kadar (kar al) veya bir geri dönüş sinyali görünene kadar mumları renkle
IX Power MT5
Daniel Stein
4.86 (7)
IX Power: Endeksler, Emtialar, Kripto Paralar ve Forex Piyasaları için İçgörüler Genel Bakış IX Power , endeksler, emtialar, kripto paralar ve forex sembollerinin gücünü analiz etmek için tasarlanmış çok yönlü bir araçtır. FX Power , tüm kullanılabilir döviz çiftlerinin verilerini kullanarak döviz çiftleri için maksimum doğruluk sağlarken, IX Power yalnızca temel sembolün piyasa verilerine odaklanır. Bu, IX Power 'ı forex dışındaki piyasalar için ideal ve daha basit forex analizleri için güven
MTF Supply Demand Zones MT5
Georgios Kalomoiropoulos
5 (1)
Yeni Nesil Otomatik Arz ve Talep Bölgeleri. Her Grafikte Çalışan Yeni ve Yenilikçi Algoritma. Tüm Bölgeler Piyasanın Fiyat Hareketine Göre Dinamik Olarak Oluşturulmaktadır. İKİ TÜR UYARI --> 1) FİYAT BİR BÖLGEYE ÇIKTIĞINDA 2) YENİ BİR BÖLGE OLUŞTURDUĞUNDA Bir tane daha işe yaramaz gösterge almazsın. Kanıtlanmış Sonuçlarla eksiksiz bir Ticaret Stratejisi elde edersiniz.     Yeni özellikler:     Fiyat Arz/Talep Bölgesine ulaştığında uyarılar     Yeni bir Arz/Talep Bölgesi oluşturulduğunda
ATrend
Zaha Feiz
4.77 (13)
ATREND: Nasıl Çalışır ve Nasıl Kullanılır ### Nasıl Çalışır "**ATREND**" göstergesi, MT5 platformu için tasarlanmış olup, traderlara sağlam alım ve satım sinyalleri sağlamak amacıyla teknik analiz metodolojilerinin bir kombinasyonunu kullanır. Bu gösterge, öncelikle volatilite ölçümü için Ortalama Gerçek Aralık (ATR) kullanır ve potansiyel piyasa hareketlerini belirlemek için trend tespit algoritmalarıyla birleştirir. Satın aldıktan sonra bir mesaj bırakın ve özel bir bonus hediyesi kazanın. ##
Precision Index Osilatörü (Pi-Osc) - Precision Trading Systems'dan Roger Medcalf Sürüm 2, grafiklerinizde hızlı bir şekilde yüklenmek üzere dikkatle yeniden kodlandı ve deneyimi artırmak için bazı teknik geliştirmeler de içerdi. Pi-Osc, herkesin stoplarını almak için zorlanan pazarların gitmek zorunda kaldığı aşırı yorgunluk noktalarını bulmak için tasarlanmış doğru ticaret zamanlama sinyalleri sunmak amacıyla oluşturuldu. Bu ürün, aşırı noktaların nerede olduğunu bilmek gibi yaşlı bir sorun
MetaBands M5
Vahidreza Heidar Gholami
4.5 (2)
MetaBands uses powerful and unique algorithms to draw channels and detect trends so that it can provide traders with potential points for entering and exiting trades. It’s a channel indicator plus a powerful trend indicator. It includes different types of channels which can be merged to create new channels simply by using the input parameters. MetaBands uses all types of alerts to notify users about market events. Features Supports most of the channel algorithms Powerful trend detection algorith
The   Time_Price_SQ9_Degree   indicator is based on the 9 Gann square. Using this indicator, you can identify strong time and price zones. The indicator displays the levels as a degree value. The degrees can be set in the settings. After launching, the MENU button appears. If it is highlighted, it can be moved to any point on the graph, and after double-clicking on it, it stops being highlighted and menu buttons appear. To hide the menu, just double-click on the button, it will become highlight
FX Dynamic: Özelleştirilebilir ATR Analiziyle Volatilite ve Trendleri Takip Edin Genel Bakış FX Dynamic , ortalama gerçek aralık (ATR) hesaplamalarını kullanarak günlük ve gün içi volatilite hakkında rakipsiz bilgiler sağlayan güçlü bir araçtır. 80%, 100%, 130% gibi net volatilite eşikleri ayarlayarak, piyasa olağan hareketlerinin ötesine geçtiğinde hızlı şekilde uyarı alabilir ve potansiyel kazanç fırsatlarını süratle tespit edebilirsiniz. FX Dynamic , brokerınızın zaman dilimine uyum sağlaya
TPSpro RFI Levels MT5
Roman Podpora
4.55 (20)
Geri dönüş bölgeleri / Tepe hacimleri / Önemli bir oyuncunun aktif bölgeleri =       TS TPSPROSİSTEMİ TALİMATLAR RUS       /       TALİMATLAR       ENG       /           Sürüm MT4        Bu göstergenin her alıcısı ayrıca ÜCRETSİZ şunları elde eder: RFI SIGNALS servisinden işlem sinyallerine 6 ay erişim - TPSproSYSTEM algoritmasına göre hazır giriş noktaları. Düzenli olarak güncellenen eğitim materyalleri - stratejiye dalın ve profesyonel seviyenizi yükseltin. Hafta içi 7/24 destek ve kapalı ya
Top indicator for MT5   providing accurate signals to enter a trade without repainting! It can be applied to any financial assets:   forex, cryptocurrencies, metals, stocks, indices .  Watch  the video  (6:22) with an example of processing only one signal that paid off the indicator! MT4 version is here It will provide pretty accurate trading signals and tell you when it's best to open a trade and close it. Most traders improve their trading results during the first trading week with the help of
RelicusRoad Pro MT5
Relicus LLC
4.78 (18)
Şimdi 147 $ (birkaç güncellemeden sonra 499 $ 'a yükseliyor) - Sınırsız Hesaplar (PC'ler veya Mac'ler) RelicusRoad Kullanım Kılavuzu + Eğitim Videoları + Özel Discord Grubuna Erişim + VIP Durumu PİYASAYA BAKMAK İÇİN YENİ BİR YOL RelicusRoad, forex, vadeli işlemler, kripto para birimleri, hisse senetleri ve endeksler için dünyanın en güçlü ticaret göstergesidir ve yatırımcılara kârlı kalmaları için ihtiyaç duydukları tüm bilgileri ve araçları sağlar. Başlangıç ​​seviyesinden ileri seviyeye ka
AÇIKLAMA ICSM (Impulse-Correction SCOB Mapper), fiyat hareketini analiz eden ve geçerli impulsları, düzeltmeleri ve SCOB'ları (Single Candle Order Block) tanımlayan göstergedir. Esnek, bilgilendirici, kullanımı kolay olması ve tüccarın en likit ilgi alanlarına yönelik farkındalığını önemli ölçüde artırması nedeniyle her türlü teknik analizle kullanılabilen güçlü bir araçtır. AYARLAR Genel | Görsel Renk teması — ICSM'nin renk temasını tanımlar. SCOB | Görsel SCOB'u göster — SCOB'u etkinleş
Auto Order Block with break of structure based on ICT and Smart Money Concepts (SMC) Futures Break of Structure ( BoS )             Order block ( OB )            Higher time frame Order block / Point of Interest ( POI )    shown on current chart           Fair value Gap ( FVG ) / Imbalance   -  MTF      ( Multi Time Frame )    HH/LL/HL/LH  -  MTF      ( Multi Time Frame )  Choch  MTF      ( Multi Time Frame )  Volume Imbalance     ,  MTF          vIMB Gap’s Power of 3 Equal High / Low’s  
Öncelikle, bu Ticaret Aracının Non-Repainting, Non-Redrawing ve Non-Lagging Gösterge olduğunu vurgulamakta fayda var, bu da onu profesyonel ticaret için ideal hale getiriyor. Çevrimiçi kurs, kullanıcı kılavuzu ve demo. Akıllı Fiyat Hareketi Kavramları Göstergesi, hem yeni hem de deneyimli tüccarlar için çok güçlü bir araçtır. İleri ticaret fikirlerini, Inner Circle Trader Analizi ve Smart Money Concepts Ticaret Stratejileri gibi 20'den fazla kullanışlı göstergeyi bir araya getirerek bir araya
Advanced Supply Demand MT5
Bernhard Schweigert
4.5 (14)
Herhangi bir Acemi veya Uzman Tüccar için En İyi Çözüm! Bu gösterge benzersiz, yüksek kaliteli ve uygun fiyatlı bir ticaret aracıdır çünkü bir dizi tescilli özelliği ve yeni bir formülü bir araya getirdik. Bu güncelleme ile çift zaman dilimi dilimlerini gösterebileceksiniz. Yalnızca daha yüksek bir TF gösteremeyeceksiniz, aynı zamanda TF grafiğini ve ARTIK daha yüksek TF'yi de gösterebileceksiniz: YUVARLAK BÖLGELERİ GÖSTERMEK. Tüm Arz Talebi tüccarları buna bayılacak. :) Önemli Bilgiler Açıkland
KT Candlestick Patterns MT5
KEENBASE SOFTWARE SOLUTIONS
KT Candlestick Patterns, en güvenilir 24 Japon mum çubuğu formasyonunu gerçek zamanlı olarak tespit eder ve grafikte gösterir. Japon traderlar, 18. yüzyıldan bu yana bu formasyonları fiyat yönünü tahmin etmek için kullanmaktadır. Her mum formasyonu aynı güvenilirliğe sahip değildir. Ancak destek/direnç gibi teknik analiz yöntemleriyle birlikte kullanıldığında, piyasanın mevcut durumunu net bir şekilde yansıtır. Bu gösterge, Steve Nison'un “Japanese Candlestick Charting Techniques” kitabında de
ICT, SMC, SMART MONEY CONCEPTS, SMART MONEY, Smart Money Concept, Support and Resistance, Trend Analysis, Price Action, Market Structure, Order Blocks, BOS/CHoCH,   Breaker Blocks ,  Momentum Shift,   Supply&Demand Zone/Order Blocks , Strong Imbalance,   HH/LL/HL/LH,    Fair Value Gap, FVG,  Premium  &   Discount   Zones, Fibonacci Retracement, OTE, Buy Side Liquidity, Sell Side Liquidity, BSL/SSL Taken, Equal Highs & Lows, MTF Dashboard, Multiple Time Frame, BigBar, HTF OB, HTF Market Structure
Yazarın diğer ürünleri
BBTrend is a relatively new indicator developed by John Bollinger to work with Bollinger Bands. It is one of only a few indicators that can signal both strength and direction making it a very valuable tool for traders. Calculations The calculations are fairly simple. The default periods of 20 and 50 are shown, but these can be changed through the parameters. Lower = MathAbs(lowerBB(20) - lowerBB(50)) Upper = MathAbs(upperBB(20) - upperBB(50)) BBTrend = (lower - upper) / middleBB(20) Interpret
FREE
NR7 and NR7IB
Anthony Garot
3 (1)
This indicator shows the narrowest bar within the past seven bars, which is known as NR7 in the literature. It will also show the NR4 bar. The range is variable; thus, you can show any two ranges, e.g. NR7/NR4, NR11/NR6, etc. For the description of this indicator, I will continue to use the default of seven (7) and four (4). If an NR7 bar also happens to be an Inside Bar, it gives a stronger signal. Thus NR7IB are denoted in another color. Sometimes this is known as NR7ID (for Inside Day). I kep
This Utility tells you the volatility of any symbol for any of the major time frames. As trades occur, the volume increases for each period. When each period ends, the bucket is reset to 0. Volumes are sorted from largest to smallest within each shown period. Click any symbol to highlight that symbol in all period columns. Volume information is specific to transactions placed at your broker. To test in the Tester, set the following: EURUSD,M1,1 minute OHLC 2018.01.01 to 2018.01.02 (a day’s worth
FREE
Filtrele:
Bernardo Carvalho
683
Bernardo Carvalho 2023.12.21 13:22 
 

Very good idea thanks

Nicoletto
210
Nicoletto 2021.07.16 14:28 
 

Muy bueno gracias.

[Silindi] 2019.01.14 07:34 
 

Kullanıcı incelemeye herhangi bir yorum bırakmadı

İncelemeye yanıt