Visual Book on Chart
- Göstergeler
- Samuel Manoel De Souza
- Sürüm: 2.41
- Güncellendi: 8 Aralık 2022
Visual Book on Chart is an indicator designed specially for stocks and futures market. To check if you can use the tool with your Broker open the MT5 Depth Of Market on your terminal and check if there are price and volume data available. Learn more about the MT5 Depth Of Market in the oficial page.
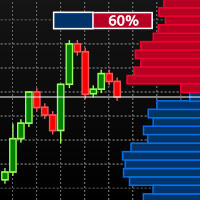
The indicator shows the depth of market data on the chart window and use gradient based on the market data to colorize the histogram bars.
The indicator is formed by two components:
- The panel, which shows the supply, demand and balance of them, as well some market info;
- The histogram, which shows the book data in a custom way;
Option of the indicator:
- Change the colors of the histogram
- Select the symbol, being able to visualize the data of another symbol;
- Display the volume as text in the histogram;
- Align to left or right;
- Show/Hide the panel;
- Show/Hide the histogram;
- Show/Hide the columns of the histogram;


good, thanks