Analytic Trade
- Göstergeler
- Pavel Krysanov
- Sürüm: 3.2
- Güncellendi: 29 Aralık 2021
- Etkinleştirmeler: 10
The Analytic Trade indicator is a complete trading system. It consists of 4 parts:
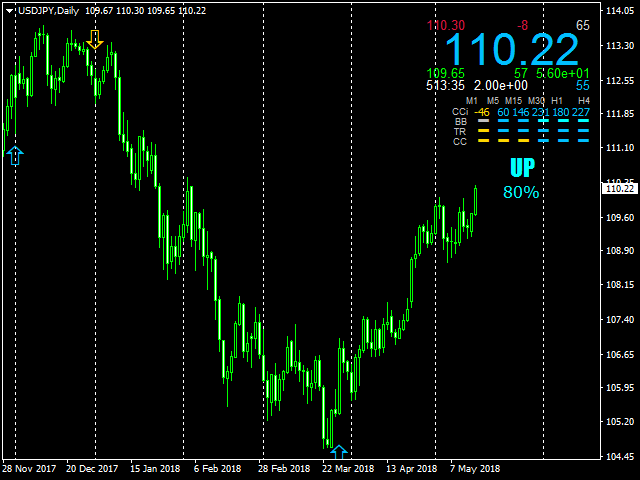
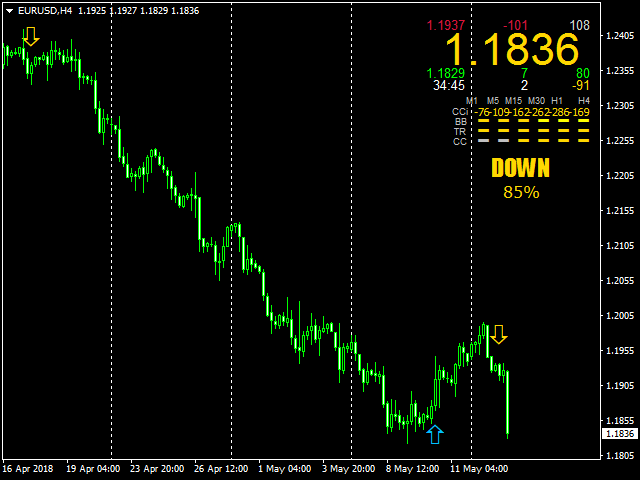
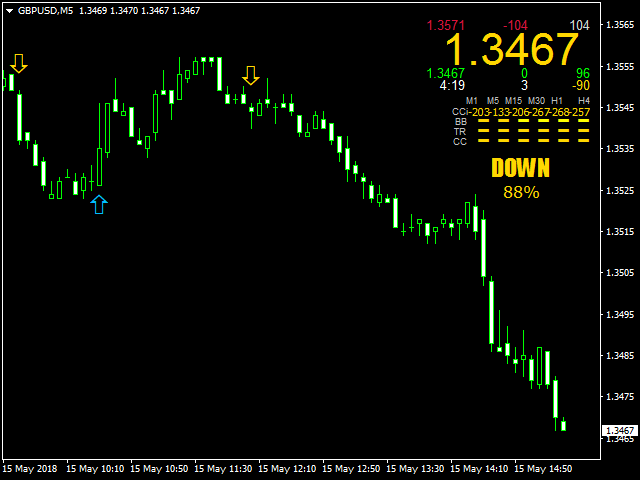
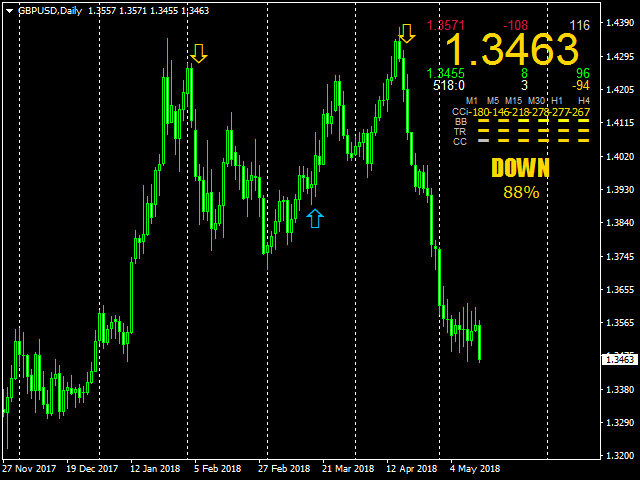
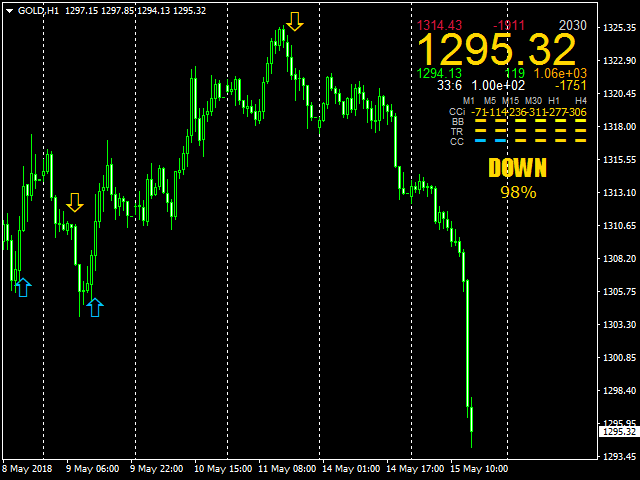
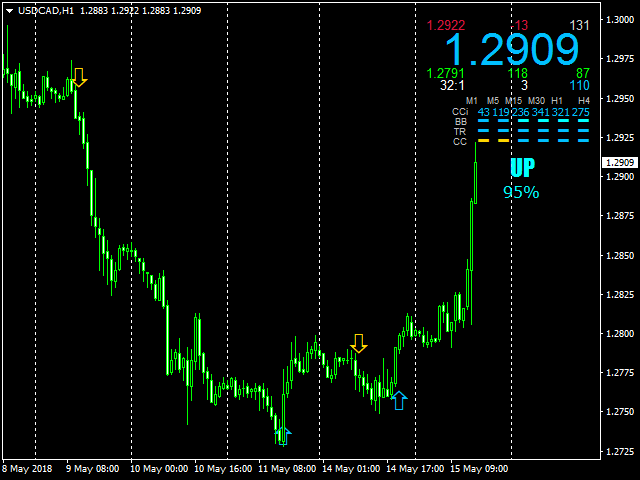
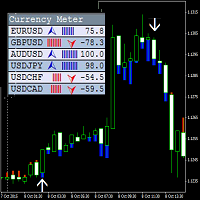
The first part is the arrows showing the most optimal points for opening and closing orders. The up arrow is a buy signal, the down arrow is a sell one.
The second part is the information panel in the upper right corner. The current price is shown in a larger font, above it are: the daily High, distance from the current price to the daily High, and the difference between the High and Low (in points). Below it are: the daily Low, the distance to the Low, the average daily price range, the time until the next candle, spread and the distance to the daily Open.
The third part is the values of the CCI and Bollinger Bands indicators, as well as the direction of the trend (TR) and the current candle (CC) for six periods of the given currency pair (M1, M5, M15, M30, H1, H4). The blue color corresponds to the ascending trend, yellow color corresponds to the descending trend.
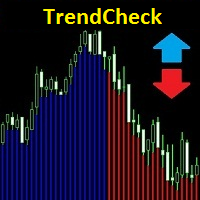
The fourth part shows the direction and strength of the trend.
The indicator does not redraw its values.
Parameters
- Period - indicator period
- EnableAlerts - use audio alerts when a signal appears
- Show_Panel - show the information panel
- MobileAlert - send notifications to the mobile terminal when a signal appears
- EmailAlert - send notifications to email when a signal appears























Kullanıcı incelemeye herhangi bir yorum bırakmadı