BearBullBalance
- Göstergeler
- Ihor Herasko
- Sürüm: 200.501
- Güncellendi: 1 Mayıs 2020
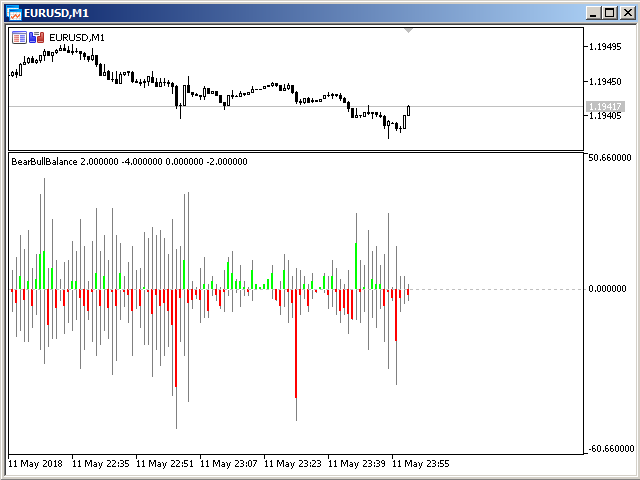
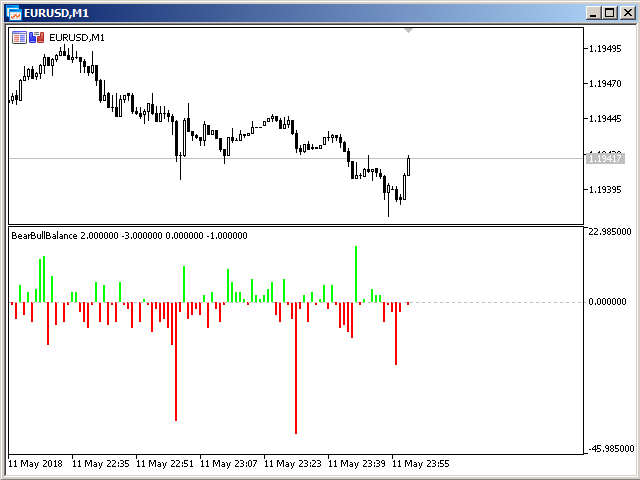
The indicator shows the number and ratio of ticks with the price growth and fall for each candle of the chart. The upper part of the histogram in the form of thin lines shows the number of price growth ticks (bullish strength), while the lower part shows the amount of price fall ticks (bearish strength). The thicker histogram bars is the difference between the strength of bulls and bears. A positive difference is displayed in green, and the negative one is red.
The strength of bulls increases when the Ask price of the current tick becomes greater than Ask of the previous tick. The strength of bears increases when the Bid price of the current tick becomes less than Bid of the previous tick.
Parameters
- Balance method - strength calculation method. If "Ticks" is selected, every price movement adds only one unit to the corresponding strength. If "Points" is selected, the number of points passed by the price in one price change is added to the strength.
- Hide general data - show ("No") or hide ("Yes") the data on the absolute value of strengths (this bars of the histogram), thus leaving only the bars of strength difference.
- Display bars count - the number of bars to display the balance of strengths for. For timeframes starting from Н1, the parameter value of 1000 or above will increase the time of data initialization.


Kullanıcı incelemeye herhangi bir yorum bırakmadı