Sürüm 1.40
2021.06.07
1. Fixed a bug that occurred when you enable a fixed chart scale.
2. Removed text mode as deprecated.
3. Added the ability to select an arrow code (from the Wingdings table) to display extrema and detail. Changed the method of displaying arrows on the screen, which allows you to more accurately select the size (more gradations of size, the default value is 12).
4. Added hotkeys for quickly switching some indicator parameters without having to enter the settings.
5. Added the ability to disable the display of the "power vector" in detail mode (disabled by default).
6. The number of density gradations of levels has been expanded from 5 to 12 (used when "Auto calc Level area" is on).
7. The range of setting the extremum radius has been expanded from 3-8 to 2-10 bars.
8. The index of the indicator (parameter "Index") now determines the priority when clicking the mouse.
9. If the indicator period differs from the chart period, but its display is disabled, it will still be shown on the label at the left edge of the chart.
10. A number of actions have been taken to optimize the performance of the indicator.
Sürüm 1.30
2021.02.13
1. Improved the appearance of graphic labels in "Modern" view mode.
2. Added transparency adjustment for levels
3. Added font weight adjustment.
4. Added "Calibri" font.
5. The abbreviated name of the period has been added to the prefix of the names of graphical objects, which makes it possible not to change the "Index" parameter when adding several indicators to the chart, working with different periods.
6. By default, the display of level parameters is disabled, except for "Price" and "Old".
Sürüm 1.22
2016.02.02
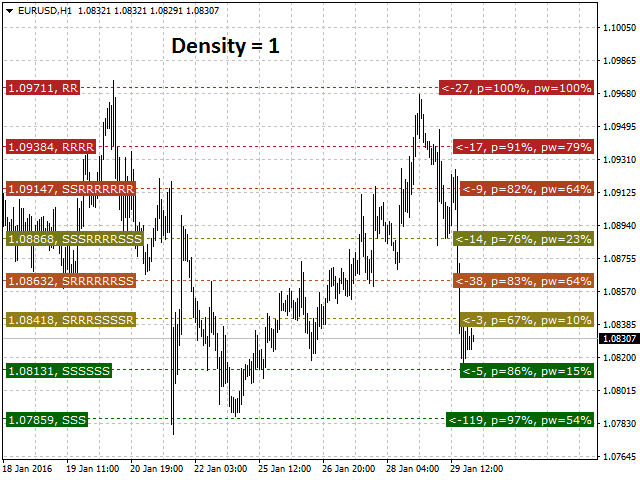
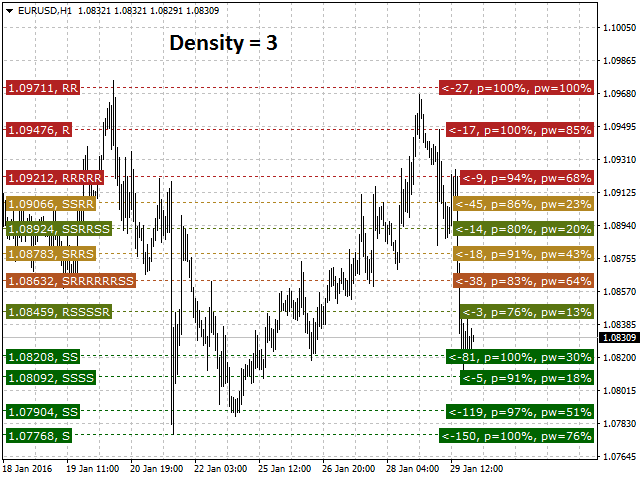
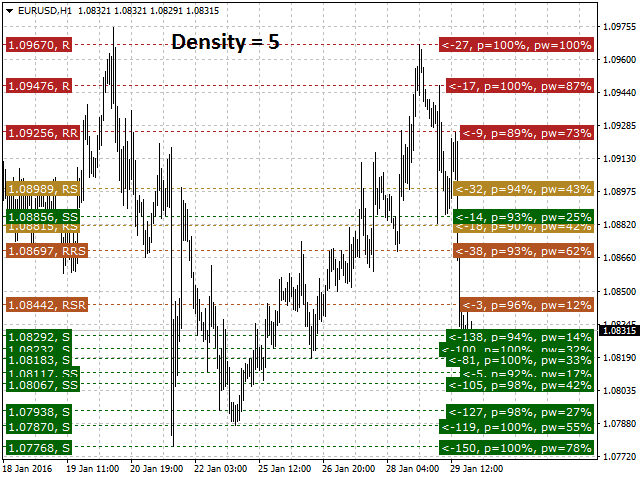
1. Added automatic calculation of the "Level area" parameter. If the value of the "Auto calc Level area" parameter is set to "true", then the value of the "Level area" will be calculated automatically. Density of the level placement will be considered in this case (the "Density of levels" parameter).
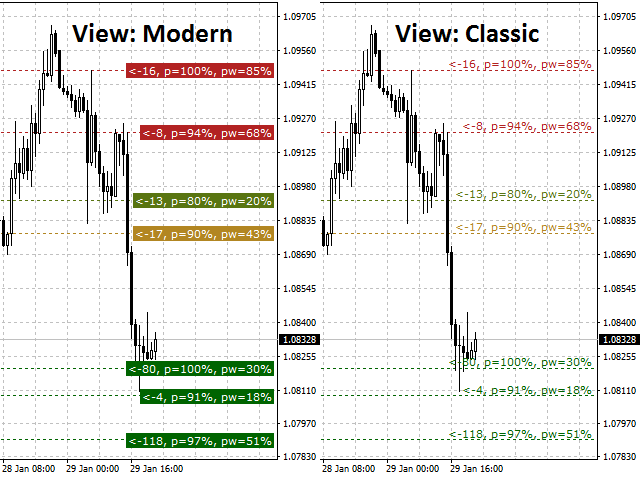
2. Added the ability to switch the type of text labels: classic and modern (label with the level background color).
3. Added the "Extrema radius" parameter.
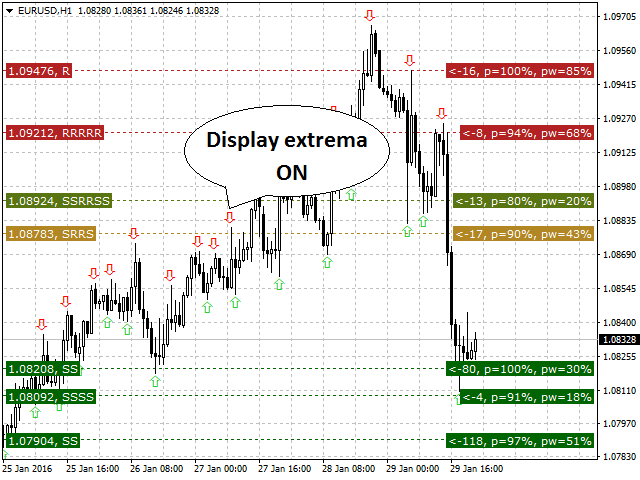
4. Added the ability to display the extrema (the "Display extrema" parameter), which is useful in the selection of the "Extrema radius" parameter.
5. Added the indication of the level "purity". It is calculated as a percentage ratio of the number of candles, that do not cross the level zone with their body, to the total amount of candles at the level's effective interval.
6. Added the level "purity" filter.
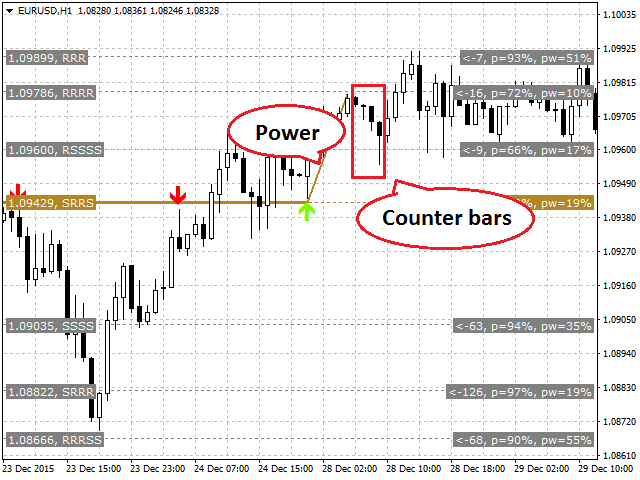
7. Added the indication of the level "strength". This is an indication of how far the price went after the last extremum was formed. It is displayed in detalization mode as a vector. The vector is plotted until there is a series of candles of the opposite direction, the number of which exceeds the value specified in the "Max counter bars" parameter. The strength of a level is displayed as a percentage. The longest vector is chosen as 100 percents, the values of the others are calculated according to it.
8. Added the level "strength" filter.
9. Added a filter that eliminates the levels to which the price had rolled back after the last extremum was formed. A rollback is an intersection of the level zone with no reaction. To enable the filter, set the "Filter: no return only" parameter to "true".
Sürüm 1.12
2015.02.25
Added ability to configure line colors.
'SUPPORT color' parameter sets support level color.
'RESISTANCE color' parameter sets resistance level color.
Color of the levels that can be considered as both support and resistance ones. The color is defined as a shade between the two specified colors.
Sürüm 1.11
2014.12.18
1. Bug fixes: after loading a template with this indicator on a chart with a different period, unnecessary graphical objects were left on the chart.
2. New parameter: "Index" (values from 0 to 255, default is 0). This is the indicator index on the chart. Apply when you need to attach two or more indicators to a chart.
Sürüm 1.10
2014.04.18
1 Added the "Usage" parameter that shows the ratio of the level length and the size of the scan area in percentage; where the level length is the distance between two extremes, and the size of the scan area is defined by the "Depth" input parameter.
2. Added four filters:
- by the minimum number of support points;
- by the minimum number of resistance points;
- by the minimum total number of support and resistance points;
- by the minimum value of the "Usage" parameter.
Filters interact on the "AND" principle. To disabling one of the filters set its value to 0. To disable all the filters set the "false" value of the "Filters enable" parameter.
3. Added the possibility to show the sequence of extrema that form a level in chronological order. For example, entry RRSR means "resistance", "resistance", "support", "resistance". It means the following: first the level twice acted as resistance, then once as support, and the last time was resistance again. The maximum length of the sequences is 32 points. If this max value is exceeded, the oldest extremes will not be taken into account.
4. Added detailed level display. When you click on any of the text labels that describe the level, the detailed mode will be enabled for this label. In this mode all extrema that form the level will be shown as arrows. The levels will not be drawn until the detail mode is disabled. To disable the detailed mode click once again on one of the text labels of the level. The availability of this mode is determined by the 'Detail allowed' parameter.
5. Added an alert. The distance to a level in points is determined by the "Alert area" parameter, hysteresis (to avoid chatter at the border) by the "Hysteresis" parameter. Alerts ara available only in the zero bar reference mode (when parameter 'Redraw when scrolling' is false).
6. Added the "Period" label (disabled by default), which displays the value of the timeframe, in which the levels are drawn. This is useful when you run several indicators that draw levels at different timeframes on one chart.
7. Fixed an error that occurred when adding several indicators on one chart.
Notes:
1 To provide correct operation of the indicator, correctly set up parameters "Level area", "Alert area" and "Hysteresis". Their values depend on the currency pair and the number of digits after the decimal point. Default parameters are calculated for the pair EURUSD with 4 decimal places.
2. Mode "Redraw when scrolling" is designed for working on historical data when drawing of levels is bound to the last right bar when you scroll the screen. That's why in this mode alerts are disabled.




















Very good tool and good support from the author :)