Currency Timeframe Strength Matrix
- Göstergeler
- Forex Pro Dynamics
- Sürüm: 1.7
- Etkinleştirmeler: 5
What is it?
The Currency TimeFrame Strength Matrix is a simple and comprehensive Forex map that gives a snapshot of what is happening in the Forex market at the very present time. It illustrates the strength and momentum characteristics of each single currency (AUD, CAD, CHF, EUR, GBP, JPY, NZD, USD) with respect to different time frames (5 seconds, 1m, 5m, 15, 30m, 1h, 4h, 1d) independently. The most unique visualization, encompassing multi currency, multi time frame and multi trend analyses all in one! It further does this by accessing a total 196 (28 pairs x 7 built-in time frames) price feeds simultaneously.
How to use it?
Useful for all strategies: Trend followers can easily identify the strongest and weakest currencies, pair them and wait for opportunities of likely continuation. Counter trend traders can interpret the strongest currency as overbought and the weakest as oversold, then wait for opportunities of reversals/retracements.
How to read it?
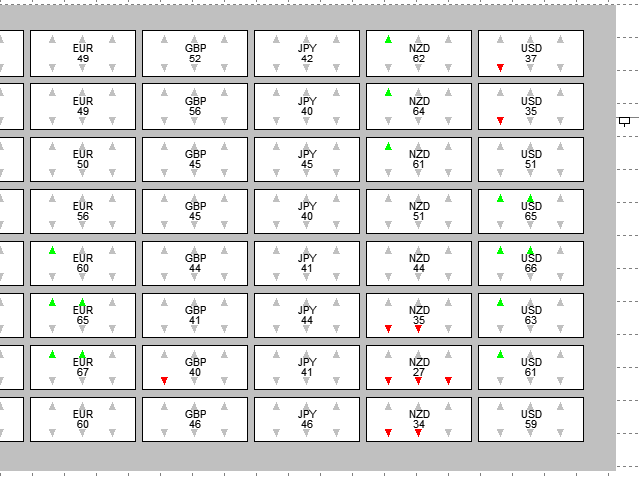
It is an 8x8 matrix with currencies (AUD, CAD, CHF, EUR, GBP, JPY, NZD, USD) along the columns and time frames (5s, 1m, 5m, 15m, 30m, 1H, 4H, 1D) along the rows; giving 64 currency time frame combination squares in total.
- Column 1: AUD
- Column 2: CAD
- Column 3: CHF
- Column 4: EUR
- Column 5: GBP
- Column 6: JPY
- Column 7: NZD
- Column 8: USD
- Row 1: 5 seconds
- Row 2: 1 minute
- Row 3: 5 minutes
- Row 4: 15 minutes
- Row 5: 30 minutes
- Row 6: 1 hour
- Row 7: 4 hours
- Row 8: 1 day
Each combination square has 3 UP pointers and 3 DOWN pointers and a score in the middle.
- Score: An integer between 0-100. Calculations are done in real time to aggregate and summarize the strength & momentum characteristics of one particular currency with respect to one particular time frame. Lower score indicates weakness, higher score indicates strength, middle score indicates neutrality.
- Up arrows (green)
- No arrows: Little or no strength/momentum.
- 1 arrow: Moderate strength/momentum.
- 2 arrows: High strength/momentum.
- 3 arrows: Very High strength/momentum.
- Down arrows (red)
- No arrows: Little or no weakness/momentum.
- 1 arrow: Moderate weakness/momentum.
- 2 arrows: High weakness/momentum.
- 3 arrows: Very High weakness/momentum.
For example. The USD column shows 2 green arrows on both the 1H row and 4H row, but 1 red arrow on both the 5s and 1m row. This means that on the overall Forex market, the USD in isolation was strong on the H1 and H4 time frames but perhaps recently stalled and may be beginning to weaken soon.
Updating feature
- Row 1: 5s. Updates every 5 seconds.
- Row 2: 1m. Updates every 1 minute.
- Row 3: 5m. Updates every 5 minutes.
- Row 4: 15m. Updates every 15 minutes.
- Row 5: 30m. Updates every 30 minutes.
- Row 6: 1H. Updates every 1 hour.
- Row 7: 4H. Updates every 4 hours.
- Row 8: Updates every 1 day.
The reason for this progressive updating lag is to help control for showing false breakouts on the higher time frames. See below scenarios for explanation.
Scenario 1. A false breakout occurs on USDJPY where price makes a sudden large up move but retraces quickly.
In this case, the shorter time frame rows will indeed show you the green arrows on USD and red arrows on JPY because they update very frequently, thus reflecting that a significant bullish move is happening now. However the longer time frame rows will not update until later. By the time they update, the retracement will have already occurred and thus the higher time frame rows will likely not reflect this move.
Scenario 2. A true breakout occurs on USDJPY where price makes a sudden large up move and stays there for a while.
In this case, the shorter time frame rows will indeed show you green arrows on USD and red arrows on JPY because they update very frequently, thus reflecting that a significant bullish move is happening now. The longer time frame rows will not update until later. But if the price move was significant enough, then these rows will likely confirm the breakout with the proper arrows and score when they update later on.
Input Parameters
- Scaling: Controls the size of the indicator on your window. Default is 1.0, it is recommended not to go below 0.7.
- Currency Prefix: Any special character that appears before your currency pair (xxxGBPUSD). Input xxx exactly as it appears.
- Currency Suffix: Any special character that appears after your currency pair (GBPUSDyyy). Input yyy exactly as it appears.


