Tick by Tick
- Göstergeler
- Leonid Basis
- Sürüm: 4.9
- Güncellendi: 20 Nisan 2020
- Etkinleştirmeler: 5
A tick is a measure of the minimum upward or downward movement in the price of a security. A tick can also refer to the change in the price of a security from one trade to the next trade.
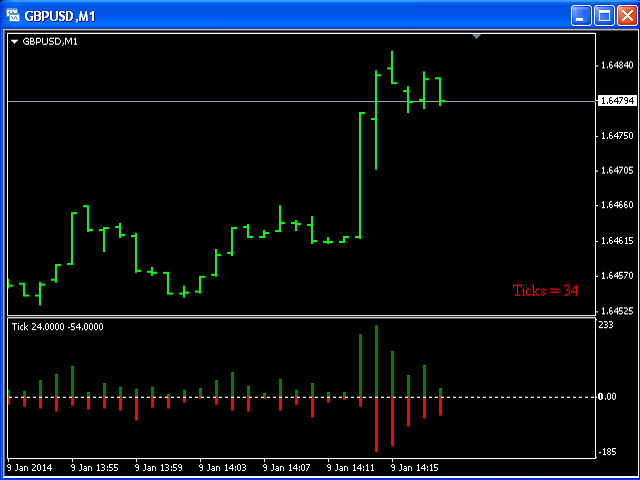
This indicator will show amounts of ticks when the price goes up and down.
This indicator is designed for M1 time frame and shows:
- Sum of points when the price goes up (Green Histogram).
- Sum of points when the price goes down (Red Histogram).


