Ticks Line Chart
- Göstergeler
- Evgeny Belyaev
- Sürüm: 3.0
- Güncellendi: 9 Kasım 2020
- Etkinleştirmeler: 6
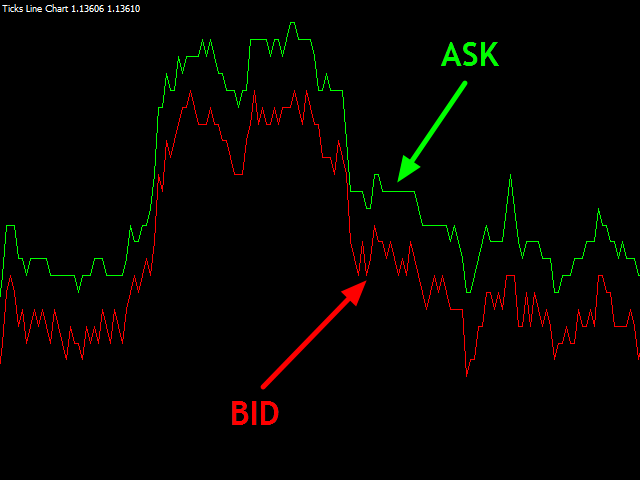
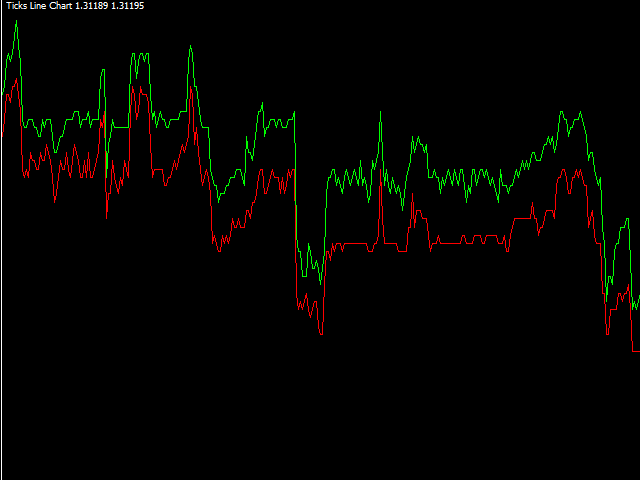
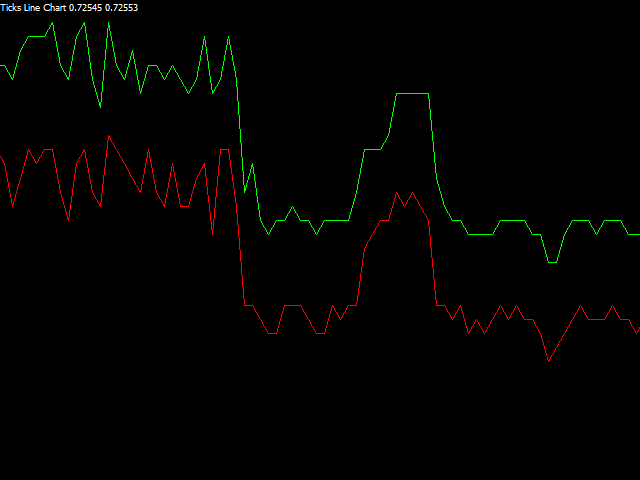
Ticks Line Chart is a professional indicator for the MetaTrader 4 platform. This indicator allows displaying a tick chart in a separate window, so that you can see price changes inside bars.
Note that the Strategy Tester of the MetaTrader 4 trading platform only shows the static spread, that is why in in the tester the distance between the ASK and Bid prices will always be the same.
Indicator Benefits
- Perfect for scalping.
- A unique indicator, there are no free analogues.
- Using the flexible indicator settings, you can adjust the indicator to your trading style.
- Works on all timeframes.
- Works on any financial instrument.
- Does not repaint/redraw.
Parameters of Ticks Line Chart
- Total ticks - the number of displayed ticks.
- Price type - the parameter can have one of four values (Bid & Ask, Bid, Ask, Average price). Bid & Ask - showing Bid and Ask on the chart (see screenshot 1). Bid - only Bid prices are displayed. Ask - only Ask prices are displayed. Average price - only the average price is displayed on the chart; it is calculated as follows: Average=(Bid+Ask)/2 (see screenshot 2).
- clrAsk - the color of the Ask price.
- clrBid - the color of the Bid price.
- clrAverage - the color of the Average price.
