Sürüm 2.20
2025.02.24
New Version Released: Geo_2Fractals Indicator (v2.2)!
The latest update of the popular Geo_2Fractals indicator is here!
Version 2.2 now displays not only the latest fractals from selected timeframes but also previous fractals—giving you a complete view of critical support and resistance levels!
No more guessing how to draw key levels—the indicator does it for you! Fractals reveal the true market structure, and now you can see them all at once.
Name: Geo_2Fractals — Intelligent Fractals Indicator for MetaTrader 4. (MT5 version coming soon!)
Automatically identifies key levels across all timeframes!
Description:
The Geo_2Fractals indicator is a professional tool for traders seeking precise support and resistance levels. It automatically detects and displays fractals across your chosen timeframes, eliminating manual work and letting you focus on trading decisions. With its smart visualization logic, levels remain clear and readable even on crowded charts.
Key Features:
✅ Multi-Timeframe Analysis:
Display fractals from 7 timeframes (M1 to W1) on a single chart
Flexible visibility settings (enable only the timeframes you need)
Customizable label offset (default: 20 pips)
✅ Advanced Visualization:
Two fractal types: First and Second (adjustable count)
Distinct styles for unbroken and broken levels
Customize colors, line thickness, and styles (dots, dashes, solid)
✅ Breakout Alerts:
Visual highlighting of broken levels
Supports all currency pairs and instruments
✅ Adaptability:
Works flawlessly with 4- and 5-digit pricing
Optimized code—minimal resource usage
Trader Benefits:
⏱ Save time—no more manual fractal hunting across timeframes
🎯 Precision—algorithm ensures no critical levels are missed
📊 Clarity—labels avoid overlap, even on busy charts
⚙️ Flexibility—customize settings to fit any strategy
📈 Multi-frame insights—spot key levels from higher timeframes directly on your chart
How It Works:
Scans selected timeframes in the background.
Detects fractals using classic rules (high/low + 2 candles on each side).
Displays levels with your preferred settings:
Custom colors for upper/lower fractals
Line styles (solid for broken levels, dashed for active levels)
Adjustable horizontal label offsets
Who It’s For:
Traders using fractals in their strategies
Scalpers analyzing M1-M15 timeframes
Swing traders focusing on H4-W1 charts
Price Action enthusiasts combining fractals with other methods
Requirements:
MetaTrader 4 (MT5 version upcoming)
Compatible with Expert Advisors and other indicators
Lightweight and resource-friendly
Transform your trading with Geo_2Fractals!
🚀 Turn fractals into a powerful element of your trading system!
Sürüm 1.3
2023.01.09
Professional fractal indicator.
Provides a multi-screen operation mode on a single open chart.
Displays the true levels of supports and resistances formed by the price itself.
It is intended both for scalpers and lovers of "accurate" inputs, and for adherents of medium- and long-term trading.
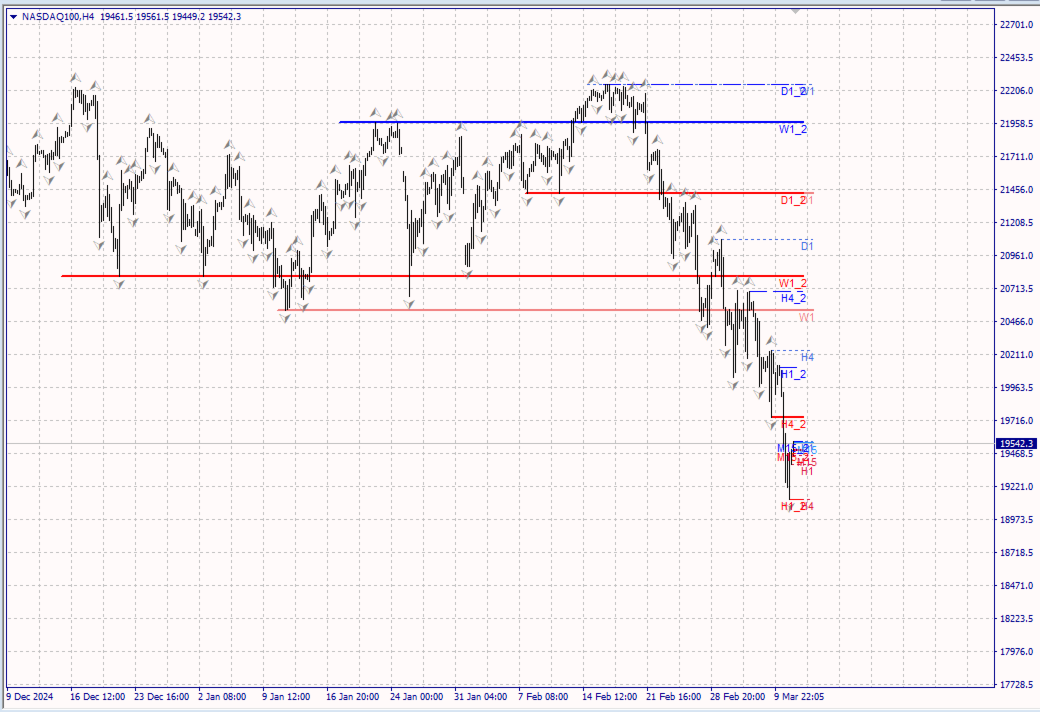
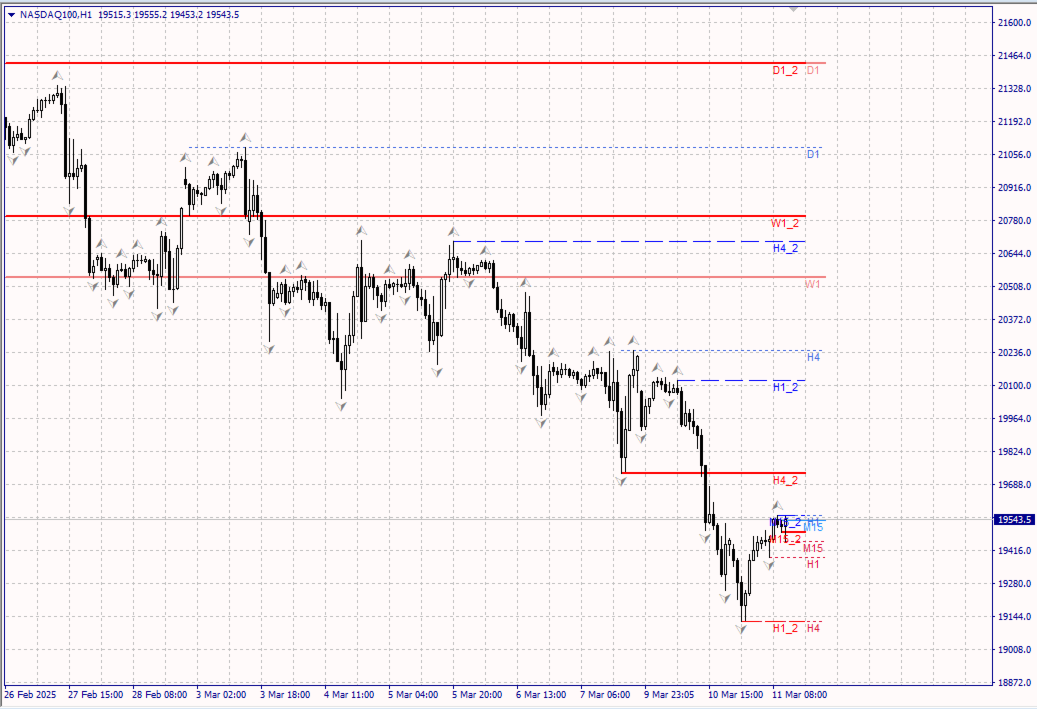
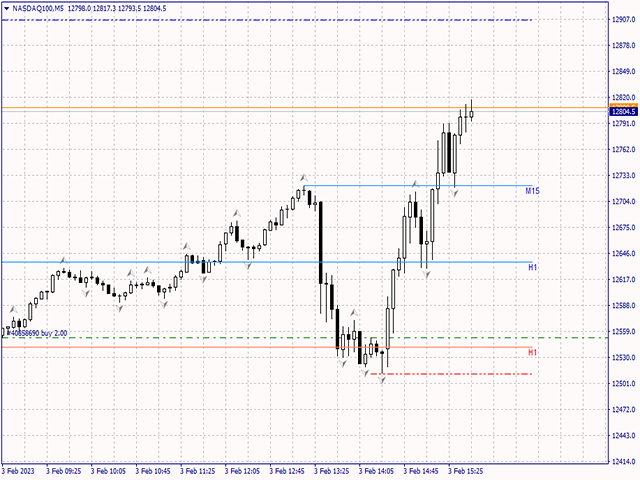
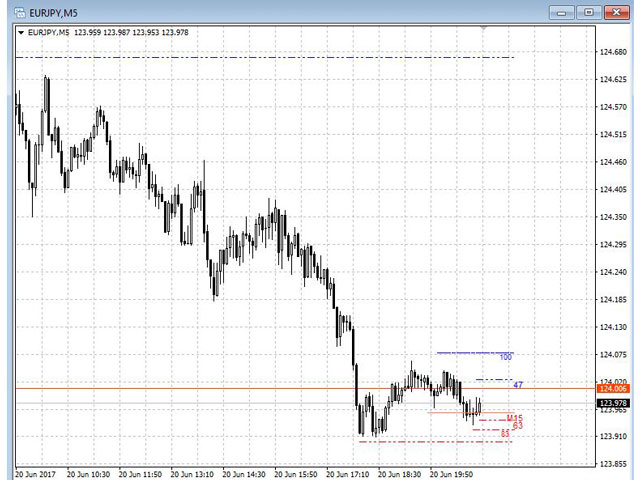
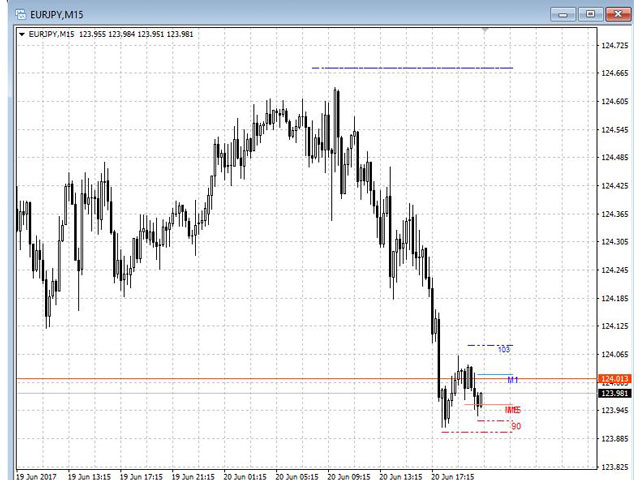
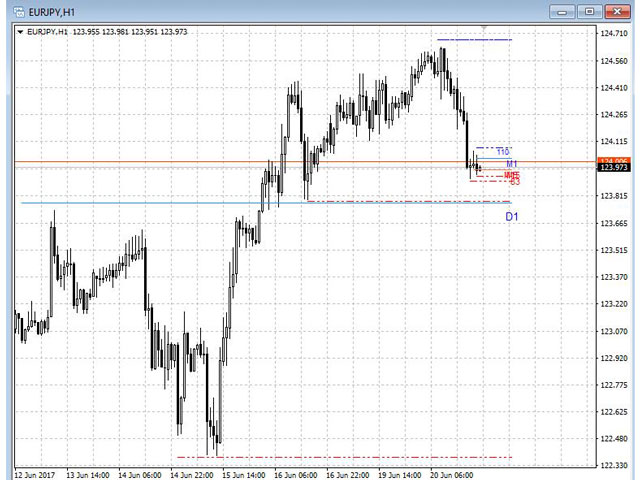
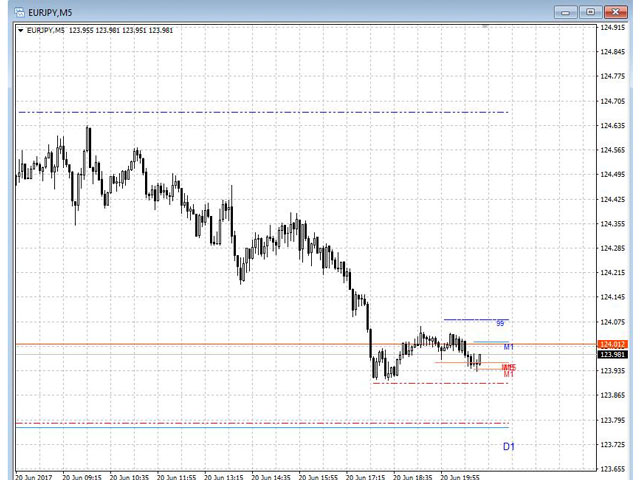
Displays fractals from seven timeframes, and also displays distances from the price to a new, emerging fractal on lower timeframes, which provides transparency of price behavior and unique accuracy of observing price behavior at pivot points.
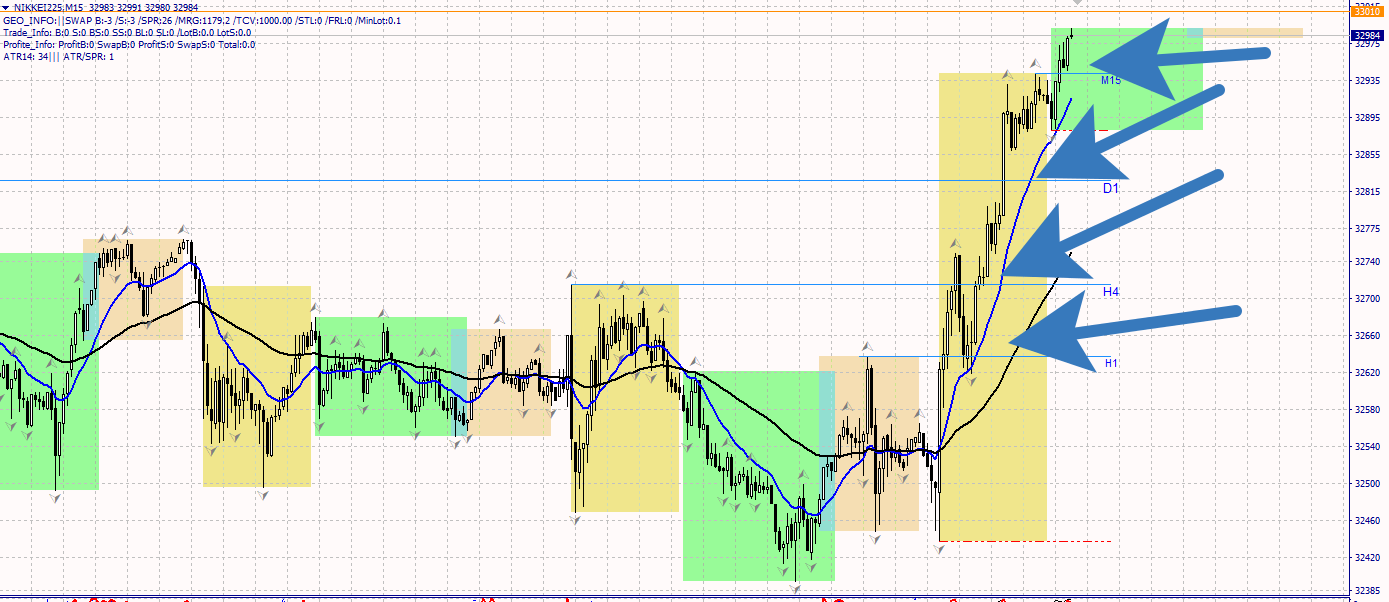
The indicator displays fractals simultaneously from timeframes W1, D1, H4, H1, M15, M5, M1.
Pay attention to how accurately these levels will show you the true support and resistance levels.
To select the necessary timeframes for display, use the appropriate indicator parameters:
ShowD1 = true;
ShowW1 = true;
ShowD1 = true;
ShowH4 = true;
ShowH1 = true;
ShowM15 = true;
ShowM5 = true;
ShowM1 = true;
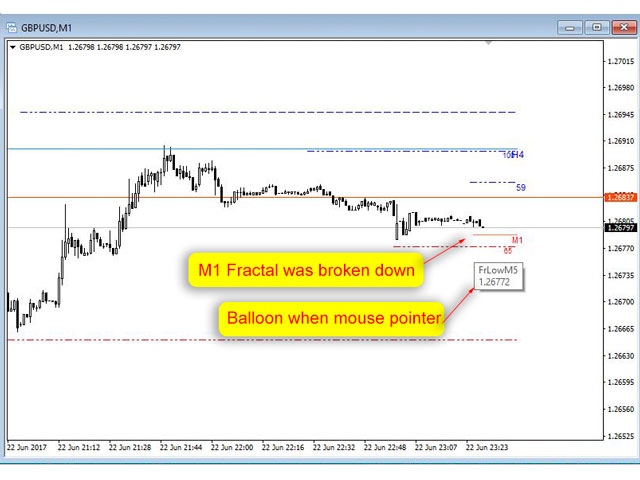
For timeframes M1 and M5, distances from the price (Bid and Ask) are displayed in points.
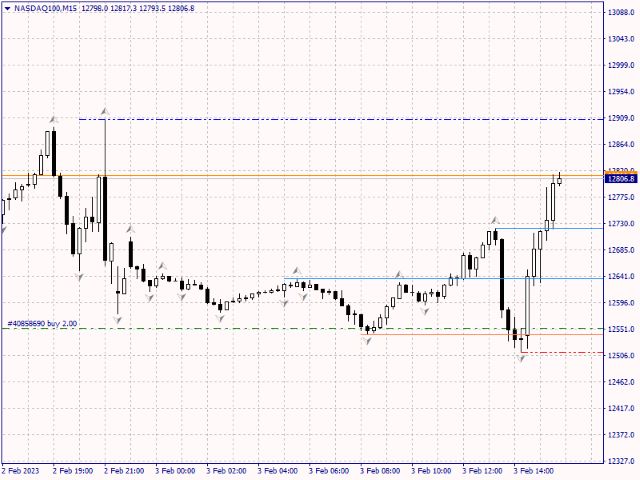
If the fractal is not broken by the price, it is displayed as a dotted line. Pop-up hints show whether the lines belong to the timeframe.
The punctured fractal is displayed as a solid line and marked with a text label indicating that the line belongs to the corresponding timeframe.
You will be able to fix the instantaneous touch of the fractal line by the price or the impossibility of breaking through this level and, based on this, make a decision on the further behavior of the price.
Only one parameter is used as an input parameter: whether or not to add 1 point (10 pips for five-digit instruments) to display the level of fractals.
Parameters
ShowW1, ShowD1, ShowH4, ShowH1, ShowM15, ShowM5, ShowM1 = true; - True or False - selection of the necessary timeframes to display
UseShift - if True, the fractal lines will move 1 point (10 pips for five-digit instruments) away from the price extremes. If False, the shift is not used. I use True. This allows you to place stops directly behind the fractal lines.
Sürüm 1.2
2017.08.15
The new version allows selecting the timeframes to be used and displaying the levels of fractals only from the selected timeframes. To select the timeframes use the parameters listed below:
ShowD1 = true;
ShowH4 = true;
ShowH1 = true;
ShowM15 = true;
ShowM5 = true;
ShowM1 = true;
for me, one of the best support resistance indicator and the best fractal! So glad I got it. HAS REALLY GOOD FEATURES YOU DO NOT GET IN OTHER INDICATORS.