• Genel bakış
  • İncelemeler
  • Yorumlar (2)

Heiken Ashi MTF ZZ

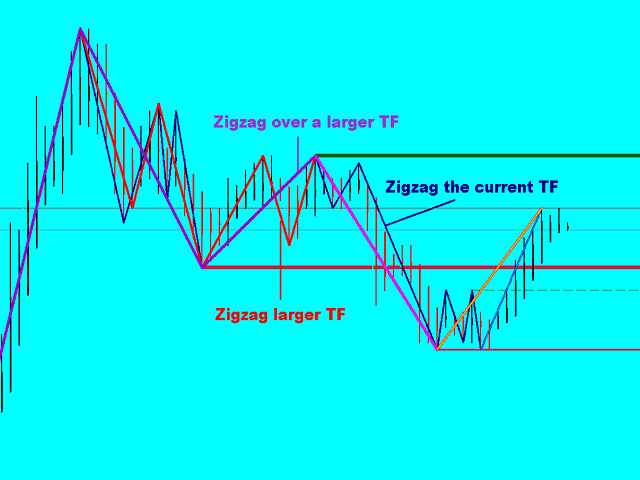
The indicator displays the price movement as three zigzags of different time periods (current, higher and even higher periods) on a single chart.

Zigzag is plotted based on the Heiken Ashi indicator and the High/Low price values.

The indicator also displays:

  1. Support and resistance levels based on the latest peaks of zigzags;
  2. Unfinished movement of the current period's zigzag, higher-period zigzag and even higher-period zigzag is displayed in another color.


Parameters

  • TimeFrame: periods tot calculate the zigzags;
  • MaxBar: amount of processed bars (0 - all);
  • zzCalculate: 0 - zigzag is not calculated, 1 - zigzag is calculated;
  • CalculateDigit: zigzags to be processed;
  • i_show_Res_Sup: true - display the current zigzag's support and resistance levels, false - do not display;
  • i_show_Res_Sup_1: true - display the higher zigzag's support and resistance levels, false - do not display;
  • i_show_Res_Sup_2: true - display the even higher zigzag's support and resistance levels, false - do not display;
  • i_showZZ_1: true - display the higher zigzag, false - do not display;
  • i_showZZ_2: true - display the even higher zigzag, false - do not display;
  • i_show_ActiveWave: true - display the unfinished movement of the current zigzag, false - do not display;
  • i_show_ActiveWave1: true - display the unfinished movement of the higher zigzag, false - do not display;
  • i_show_ActiveWave2: true - display the unfinished movement of the even higher zigzag, false - do not display;
  • Resistance: resistance color of the current zigzag;
  • Resistance1: resistance color of the higher zigzag;
  • Resistance2: resistance color of the even higher zigzag;
  • Support: support color of the current zigzag;
  • Support1: support color of the higher zigzag;
  • Support2: support color of the even higher zigzag;
  • ActiveWave: color of the unfinished move of the current period's zigzag;
  • ActiveWave1: color of the unfinished move of the higher zigzag;
  • ActiveWave2: color of the unfinished move of the even higher zigzag;
  • STYLE_Resistance: resistance line style of the current zigzag;
  • STYLE_Support: support line style of the current zigzag;
  • _Resistance: resistance line width of the current zigzag;
  • _Resistance1: resistance line width of the higher zigzag;
  • _Resistance2: resistance line width of the even higher zigzag;
  • _Support: support line width of the current zigzag;
  • _Support1: support line width of the higher zigzag;
  • _Support2: support line width of the even higher zigzag;
  • _ActiveWave: width of the current period zigzag's unfinished move line;
  • _ActiveWave1: width of the higher zigzag's unfinished move line;
  • _ActiveWave2: width of the even higher zigzag's unfinished move line.
Önerilen ürünler
Индикатор ищет подобную ценовую структуру, сравнивая с последней ценовой структурой. Размер паттерна (грубо говоря количество переломов зигзага) настраивается (всегда меньше на 1, чем введено - нулевой перелом не считается). Все найденные совпадения отмечаются прямоугольником. Так же к паттернам существует быстрая навигация с помощью кнопочек "Next patt" и "Prev patt". В индикатор вшиты два индикатора типа ЗигЗа г : стандартный зигзаг и пользовательский , моей разработки. Параметры настройки ста
Heiken Ashi Signal göstergesi MT4 ticaret terminali için tasarlanmıştır. Mt4 terminalinde bulunan standart Heiken Ashi göstergesine dayanmaktadır. Gösterge, yazarın Uzman Danışmanları tarafından otomatik ticaretin yanı sıra manuel olarak da kullanılabilir. Ticaret EA'larında Heiken Ashi Sinyal göstergesini kullanmak için, piyasaya giriş ve alım satım pozisyonları açmak için sinyal tamponları vardır. Daha fazlasını aşağıda okuyabilirsiniz. Heiken Ashi Sinyal göstergesinin özellikleri ve özelli
Least Square MA   Description: The Least Square Moving Average indicator allows you to assess the direction of the market movement and its possible reversals. The indicator is a line that is displayed in the price window. Input parameters: LSMA_Period - the period for calculating the moving average using the least squares method; Prediction - the number of candles used to construct the predicted moving average using the least squares method, provided that its rate (falling or growing remains); D
R747 BreakLevels
Radek Reznicek
5 (1)
R747 BreakLevels is smart indicator that automatically detects Support and Resistance levels on actual market trend. Strength of levels can be easily adjusted by changing parameter LevelsStrength in range of 2 (weak levels) and 50 (strong levels). This indicator is accessible in EA via iCustom functions and is fully customizable by user. There is possibility to send Push notifications and Alerts of newly found levels. Follow this link to get all detailed information:  >> LINK << Features Adjusta
Elliot's Triangle is taken from 1 of the 13 patterns within the Elliot Wave Theory that says social or crowd behaviour tends to reverse in recognisable patterns and of which they reveal a structural pattern that appears in nature, as well as the mass psychology of trading participants. From this, he has devised various identifiable patterns that appear in market prices. One of these is what I have named Elliot's Triangle. This triangular pattern appears to reflect a balance of forces, causing
The Turning point of price indicator displays assumed turning points of the price on the chart. It is based on data of the Prise Reversal oscillator and standard ADX. When the value of Prise Reversal is in overbought or oversold area (area size is set by a user), and the value of the ADX main line exceeds the preset value, the Turning point of price indicator draws an arrow pointed to the further assumed price movement. This idea is described in the article Indicator of Price Reversal . Indica
The indicator allows you to trade binary options. The recommended time frame is М1 and the expiration time is 1,2,3 minutes. The indicator suitable for auto and manual trading. A possible signal is specified as a arrows above/under a candle. You should wait until the candle closes! Arrows are not re-painted Trade sessions: TOKYO section (Half-end) Currency pairs: USD/JPY Working time frame: M1 Expiration time: 1,2,3 minutes. The indicator also shows good results when using the martingale strateg
FREE
Weiss Wave
Giordano Gorghetto
If you are a market operator looking for an advanced solution to identify trends and trend reversals in financial markets, the Weiss Wave indicator could be what you need. Based on the principle of Elliott wave analysis and combining multiple indicators, the indicator provides a comprehensive view of the market in an easy and intuitive way, even for less experienced traders. With clear and easy-to-interpret buy/sell signals, the indicator provides reliable guidance for identifying trends and tre
"Adjustable Fractals" - is an advanced version of fractal indicator, very useful trading tool! As we know   Standard fractals mt4 indicator does not have settings at all   - this is very inconvenient for traders Adjustable Fractals has resolved that issue - it has all necessary settings: Adjustable period   of indicator (recommended values - above 7) Adjustable distance   from Highs/Lows of price Adjustable design   af fractal arrows // More great Expert Advisors and Indicators are available he
Forex Indicator "Trend Correction Histogram" for MT4 Trend Correction Histogram can be in 2 colors: red for bearish trend and blue for bullish one 7 consecutive histogram columns of the same color means beginning of new trend Trend Correction Histogram indicator designed with the main purpose - to minimize losses and maximize profit It has parameter - "Period", responsible for indicator's sensitivity Built-in Mobile and PC alerts  Trend Correction Histogram can be use as a simple but profitable
Alan Hull's moving average, more sensitive to the current price activity than the normal MA. Reacts to the trend changes faster, displays the price movement more clearly. When the indicator color changes, it sends a push notification to the mobile device, a message to the email and displays a pop-up alert. Parameters Period - smoothing period, recommended values are from 9 to 64. The greater the period, the smoother the indicator. Method - smoothing method, may range from 0 to 3. Label - text
Top Bottom Tracker , piyasa trendini analiz eden ve trendin en yüksek ve en düşük seviyelerini tespit edebilen sofistike algoritmalara dayanan bir göstergedir / MT5 sürümü . Fiyat 500$'a ulaşana kadar kademeli olarak artacaktır. Sonraki fiyat --> $99 Özellikler Yeniden boyama yok Bu gösterge, yeni veriler geldiğinde değerlerini değiştirmez İşlem çiftleri Tüm forex çiftleri Zaman Dilimi Tüm zaman dilimleri Parametreler ==== Gösterge yapılandırması ==== Konfigürasyon param
Part of ATR
Staffan Ofwerman
This indicator is just a simple ATR indicator. It calculates the Average True Range and let you tell it to show the percentage of the ATR. You will then see the % of the ATR on the screen. I like to use it to calculate different things for my trading. If I use the really great AW Recovery System ( https://www.mql5.com/en/market/product/28868 ) there is a great strategy made by the developer, where you watch the daily ATR and set the steps calculated on part of the ATR. So if you put the Part of
Range Multi Alligators provides Range Channel High Low Information and the market trend indicated by the blue-red Histogram in the middle of range channel. The range channel lines is useful to define stoploss and take profit. This is trend follower indicator based on the Multi Alligators. Attach it on the chart and change one or all setting then all lines will move synchronously with the current one. Parameters Period : the number of bars used for the indicator calculations. Default: 120 used
Heiken Ashi Smoothed Strategy is a very simple but powerful system to get forex market trend direction. This indicator is actually 2 indicators in 1 pack, Heiken Ashi and Heiken Ashi Smoothed Moving Average both included. Because HA (Heiken Ashi) and HAS (Heiken Ashi Smoothed) are calculated in the same one system event with necessary buffers and loop only, so it is the FAST, OPTIMIZED and EFFICIENT HA having the combined indicator of MetaTrader 4. You can choose to display HA and HAS in the sam
Break Moment
Svyatoslav Kucher
5 (1)
Break Moment is a unique proprietary indicator with extensive capabilities and a variety of settings. It can be used as a signal generator or as an auxiliary tool. For the calculations, the price channel is determined. When it is broken, if all conditions of the additional filter are met, it displays a signal in the form of a histogram. Break Moment can be used to determine the main trend, as it has 2 filters for determining it in addition to everything else. If these filters are activated, the
Pair Spread Indicator The indicator shows the difference in price between the two instruments. : Graph in the form of a histogram of the difference in price between the two instruments in a separate window. Ideal for related tools for example:  BRN -- WTI,   GOLD -- 50* Silver, DJ -- 14*S&P500, etc; Calculation method: closing price (open, high, low) N-bars back; Moving average on the histogram; Averaging options for the moving average: simple, exponential, smoothed, etc; The negative coeffici
Heiken Ashi On One Chart Mode MT4 The indicator is displayed only on one of the chart modes: Bars, Candles, Line. The default is Bars. When switching the chart mode, the indicator is displayed or disappears depending on the chart mode. Input parameters: iChartMode: on what chart mode should the indicator be displayed mBars mCandles mLine Colors: LightSeaGreen: bull candle Tomato: bear candle
Colored candles
Alexander Nikolaev
Some candles have a strong tendency to continue the movement or to revert it. With the help of the Colored candles indicator such movements are clearly visible. This indicator calculates the parameters of each candle, as well as its volume, and after that it paints the candles depending on its strength and direction. Bullish candles are colored green and bearish candles - red. The greater the power of the bulls or the bears, the brighter the color. You can change the colors if you want. The indi
Forex Indicator  " ATR Trailing Stop"  for MT4 Upgrade   your trading methods with great auxiliary ATR Trailing Stop  indicator for MT4. This indicator is perfect for     Trailing Stop purpose ATR Trailing Stop   is  automatically adaptive   to market volatility No delays and easy set up This indicator is excellent to combine with price action entries into the direction of main trend // More great Expert Advisors and Indicators are available here:  https://www.mql5.com/en/users/def1380/seller It
The indicator determines the state of the market: trend or flat. The state of the market is determined by taking into account volatility. The flat (trading corridor)is displayed in yellow. The green color shows the upward trend. The red color shows the downward trend. The height of the label corresponds to the volatility in the market. The indicator does not redraw . Settings History_Size   - the amount of history for calculation. Period_Candles  - the number of candles to calculate the
Venom
Yaroslav Varankin
Venom indicator is a new type of indicator for scalping with high accuracy of correct predictions in the indicator you can select the indicator signal does not redraw, does not disappear, you can trust it 100% When a red blue arrow appears under the candlestick, an UP option is purchased. When red arrows appear, the DOWN option is purchased. the indicator is based on our new development, if there is an order with a large amount that opens in the direction we need, according to the analysis of th
Channel Oscillations is a non-redrawing channel indicator based on moving averages. The key difference between the Channel Oscillations indicator and other channel indicators is that Channel Oscillations does not take into account simple moving averages, but double-smoothed ones, which, on the one hand, makes it possible to more clearly determine the market movement, and on the other hand, makes the indicator less sensitive.
ADX Pointer is an indicator which is based on "Average Directional Index" and draws three numbers in chart window depending on the value of ADX. In ADX Pointer you can set "ADX_Period" which is of course period of Average Directional Index and you can also set 3 levels. When ADX value exceed first level ("ADX_Level1") in chart window appears number "1", when ADX exceed second level ("ADX_Level2") appears "2" and when ADX exceed third level ("ADX_Level3") appears "3". Simple. ADX Pointer works on
Bu işlem aracıyla aynı anda 15 piyasayı tarayabilirsiniz. Karşınızda yeni ticaret göstergesi 2024: ️ Kontrol Paneli Çoklu Para Birimi Çoklu Zaman Çerçevesi Stokastik. Bu ticaret aracını oluşturmamın en az iki nedeni var: Öncelikle tek piyasayı gözlemlemekten sıkıldım. İkincisi, başka bir pazara giriş anını kaybetmek istemiyorum. Bu yüzden aynı zamanda diğer piyasa koşullarını da bilmek istiyorum. Bu nedenle birden fazla piyasanın koşullarını aynı anda tarayabilecek bir tarayıcıya i
Owl smart levels
Sergey Ermolov
4.58 (55)
MT5 versiyonu  |  FAQ Owl Smart Levels Indicator ,   Bill Williams'ın gelişmiş fraktalları , piyasanın doğru dalga yapısını oluşturan Valable ZigZag ve kesin giriş seviyelerini gösteren   Fibonacci seviyeleri   gibi popüler piyasa analiz araçlarını içeren tek gösterge içinde eksiksiz bir ticaret sistemidir. pazara ve kar elde edilecek yerlere. Stratejinin ayrıntılı açıklaması Gösterge ile çalışma talimatı Baykuş Yardımcısı ticaretinde Danışman Yardımcısı Kullanıcıların özel sohbeti -> Satın ald
DYJ Alligator SignalSource   is based on Alligator   indicator. It can be used for any currency pair and timeframe. The blue line (Alligator's Jaw) is the Balance Line for the timeframe that was used to build the chart (13-period Smoothed Moving Average, moved into the future by 8 bars); Red Line (Alligator's Teeth) is the Balance Line for the value timeframe of one level lower (8-period Smoothed Moving Average, moved by 5 bars into the future); Green Line (Alligator's Lips) is the Balance Line
Trend Bars
Harun Celik
5 (1)
Trend Bars indicator is a trend indicator working with a set of algorithms and a set of indicators. Trend finds trends by using many factors while you are there. This indicator has 4 mode features. Mode 1 represents short-term trends. Mode 2 represents medium to short term trends. Mode 3 represents medium to long term trends. Mode 4 represents long term trends. Easy to use and simple indicator. The user can easily understand the trends. This indicator has 3 trend features. Up trend, down trend a
DeMarker (DeM) indicator is another member of the Oscillator family of technical indicators. Traders use the index to determine overbought and oversold conditions, assess risk levels, and time when price exhaustion is imminent. This indicator shows DeMarker data from 9 currency pairs of your choice for all 9 timeframes. If a digital value of DeM is less or equal to DnLevel = 0.3 (or whatever number you decided to put), Green square appears. This is potentially an oversold condition and may be a
Bu ürünün alıcıları ayrıca şunları da satın alıyor
Gann Made Easy
Oleg Rodin
4.87 (95)
Gann Made Easy , bay teorisini kullanarak ticaretin en iyi ilkelerine dayanan, profesyonel ve kullanımı kolay bir Forex ticaret sistemidir. WD Gann. Gösterge, Zararı Durdur ve Kâr Al Seviyeleri dahil olmak üzere doğru SATIN AL ve SAT sinyalleri sağlar. PUSH bildirimlerini kullanarak hareket halindeyken bile işlem yapabilirsiniz. Lütfen satın aldıktan sonra benimle iletişime geçin! Alım satım ipuçlarımı ve harika bonus göstergelerini ücretsiz olarak sizinle paylaşacağım! Muhtemelen Gann ticaret y
Gold Stuff
Vasiliy Strukov
4.9 (269)
Gold Stuff, özellikle altın için tasarlanmış bir trend göstergesidir ve herhangi bir finansal enstrümanda da kullanılabilir. Gösterge yeniden çizilmez ve gecikmez. Önerilen zaman dilimi H1. Bu göstergede tam otomatik Uzman Danışman EA Gold Stuff çalışır. Profilimde bulabilirsiniz. Ayarları ve kişisel bir bonusu almak için satın alma işleminden hemen sonra benimle iletişime geçin!  Güçlü Destek ve Trend Tarayıcı göstergemizin ücretsiz bir kopyasını pm'den alabilirsiniz. Ben! AYARLAR Ok Ç
Scalper Inside PRO
Alexey Minkov
4.75 (60)
An exclusive indicator that utilizes an innovative algorithm to swiftly and accurately determine the market trend. The indicator automatically calculates opening, closing, and profit levels, providing detailed trading statistics. With these features, you can choose the most appropriate trading instrument for the current market conditions. Additionally, you can easily integrate your own arrow indicators into Scalper Inside Pro to quickly evaluate their statistics and profitability. Scalper Inside
Trend Pulse
Mohamed Hassan
5 (3)
Please contact me after purchase to immediately get your PDF strategy + documentation for Trend Pulse !  Official release price of $99  ( 12 / 50 copies left). Next price is $199 . Introducing Trend Pulse , a unique and robust indicator capable of detecting bullish, bearish, and even ranging trends! Trend Pulse uses a special algorithm to filter out market noise with real precision. If the current symbol is moving sideways, Trend Pulse will send you a ranging signal, letting you know that
Trend Punch
Mohamed Hassan
4.95 (21)
This indicator is unstoppable when combined with our other indicator called  Support & Resistance . After purchase, send us a message and you will get it   for  FREE as a BONUS! Introducing Trend Punch , the revolutionary forex trend indicator that will transform the way you trade! Trend Punch is uniquely designed to provide precise buy and sell arrows during strong market trends, making your trading decisions clearer and more confident. Whether you're trading major currency pairs or exotic sym
FX Power MT4 NG
Daniel Stein
5 (12)
Sabah Brifingimiz burada mql5 ve on Telegram! FX Power MT4 NG , uzun zamandır çok popüler olan döviz gücü ölçerimiz FX Power'ın yeni neslidir. Peki bu yeni nesil güç ölçer ne sunuyor? Orijinal FX Power hakkında sevdiğiniz her şey PLUS GOLD/XAU güç analizi Daha da hassas hesaplama sonuçları Ayrı ayrı yapılandırılabilir analiz dönemleri Daha da iyi performans için özelleştirilebilir hesaplama limiti Özel çokluDaha fazlasını görmek isteyenler için örnek ayarlar Her grafikte en sevdiğiniz renkler i
Currency Strength Wizard , başarılı ticaret için size hepsi bir arada çözüm sağlayan çok güçlü bir göstergedir. Gösterge, birden çok zaman dilimindeki tüm para birimlerinin verilerini kullanarak şu veya bu forex çiftinin gücünü hesaplar. Bu veriler, şu veya bu para biriminin gücünü görmek için kullanabileceğiniz, kullanımı kolay para birimi endeksi ve para birimi güç hatları biçiminde temsil edilir. İhtiyacınız olan tek şey, işlem yapmak istediğiniz tabloya göstergeyi eklemektir ve gösterge size
ÜRÜNÜ SATIN ALMADAN ÖNCE LÜTFEN AŞAĞIDAKİ BİLGİLERİ OKUYUNUZ! Apollo Pips PLUS SP benzersiz bir üründür! YENİ "APOLLO PIPS" GÖSTERGEMİ ARTI TÜM İŞLEM GÖSTERGELERİME ERİŞİM İLE "SÜPER PAKET" BONUSUNU ALMAK İSTEYENLER İÇİN! Apollo Pips PLUS SP ürününü satın alarak aslında Apollo Pips göstergemin tamamen yeni bir versiyonunu satın almış oluyorsunuz. Göstergenin bu sürümü, geliştirilmiş bir algoritmaya ve kullanımı kolay bir parametreye sahiptir; bu, size göstergeyi herhangi bir piyasada ve herhangi
Atomic Analyst
Issam Kassas
5 (3)
Öncelikle belirtmek gerekir ki bu Ticaret Göstergesi Yeniden Çizim Yapmaz, Gecikmez ve Gecikme Göstermez, bu da hem manuel hem de robot ticareti için ideal hale getirir. Kullanıcı kılavuzu: ayarlar, girişler ve strateji. Atom Analisti, Piyasada Daha İyi Bir Avantaj Bulmak İçin Fiyatın Gücünü ve Momentumunu Kullanan PA Fiyat Hareketi Göstergesidir. Gürültüleri ve Yanlış Sinyalleri Kaldırmaya ve Ticaret Potansiyelini Artırmaya Yardımcı Olan Gelişmiş Filtrelerle Donatılmıştır. Birden fazla katma
Öncelikle, bu Ticaret Aracının Non-Repainting, Non-Redrawing ve Non-Lagging Gösterge olduğunu vurgulamakta fayda var, bu da onu profesyonel ticaret için ideal hale getiriyor. Çevrimiçi kurs, kullanıcı kılavuzu ve demo. Akıllı Fiyat Hareketi Kavramları Göstergesi, hem yeni hem de deneyimli tüccarlar için çok güçlü bir araçtır. İleri ticaret fikirlerini, Inner Circle Trader Analizi ve Smart Money Concepts Ticaret Stratejileri gibi 20'den fazla kullanışlı göstergeyi bir araya getirerek bir araya g
ŞU ANDA %26 INDIRIMLI Yeni Başlayanlar veya Uzman Tüccarlar için En İyi Çözüm! Bu Gösterge benzersiz, yüksek kaliteli ve uygun fiyatlı bir ticaret aracıdır çünkü bir dizi tescilli özellik ve yeni bir formül ekledik. Sadece BİR grafik ile 28 Forex çifti için Döviz Gücünü okuyabilirsiniz! Yeni bir trendin veya scalping fırsatının tam tetik noktasını belirleyebildiğiniz için ticaretinizin nasıl gelişeceğini hayal edin? Kullanım kılavuzu: buraya tıklayın Bu ilk olan, orijinal! Değersiz bir
Tanıtım       Kuantum Trend Keskin Nişancı Göstergesi   , trend tersine dönmeleri belirleme ve ticaret yapma şeklinizi değiştiren çığır açan MQL5 Göstergesi! 13 yılı aşkın ticaret tecrübesine sahip deneyimli tüccarlardan oluşan bir ekip tarafından geliştirilmiştir.       Kuantum Trend Keskin Nişancı Göstergesi       trend dönüşlerini son derece yüksek doğrulukla belirlemenin yenilikçi yolu ile ticaret yolculuğunuzu yeni zirvelere taşımak için tasarlanmıştır. ***Kuantum Trend Keskin Nişancı Gö
M1 Arrow
Oleg Rodin
4.73 (15)
Piyasanın iki temel ilkesine dayanan bir gün içi stratejisi. Algoritma, ek filtreler kullanarak hacimlerin ve fiyat dalgalarının analizine dayanmaktadır. Göstergenin akıllı algoritması, yalnızca iki piyasa faktörü bir araya geldiğinde bir sinyal verir. Gösterge, daha yüksek zaman çerçevesinin verilerini kullanarak M1 grafiğinde belirli bir aralıktaki dalgaları hesaplar. Ve dalgayı doğrulamak için gösterge, hacme göre analizi kullanır. Bu gösterge hazır bir ticaret sistemidir. Bir tüccarın ihtiya
TPSpro RFI Levels
Roman Podpora
4.83 (23)
Reversal First Impulse levels (RFI)    INSTRUCTIONS        RUS       -       ENG              R ecommended to use with an indicator   -   TPSpro  TREND PRO -  Version MT5 A key element in trading is zones or levels from which decisions to buy or sell a trading instrument are made. Despite attempts by major players to conceal their presence in the market, they inevitably leave traces. Our task was to learn how to identify these traces and interpret them correctly. Main functions: Displaying activ
TPSproTREND PrO
Roman Podpora
4.78 (18)
TPSpro TRENDPRO  - is a trend indicator that automatically analyzes the market and provides information about the trend and each of its changes, as well as giving signals for entering trades without redrawing! The indicator uses each candle, analyzing them separately. referring to different impulses - up or down impulse. Exact entry points into transactions for currencies, crypto, metals, stocks, indices!  Version MT5             DETAILED DESCRIPTION              R ecommended to use with an indi
Break and Retest
Mohamed Hassan
4.4 (15)
This Indicator only places quality trades when the market is really in your favor with a clear break and retest. Patience is key with this price action strategy! If you want more alert signals per day, you increase the number next to the parameter called: Support & Resistance Sensitivity.  After many months of hard work and dedication, we are extremely proud to present you our  Break and Retest price action indicator created from scratch. One of the most complex indicators that we made with ove
Trend Screener
STE S.S.COMPANY
4.82 (92)
Trend Göstergesi, Trend Alım Satım ve Filtreleme için Çığır Açan Benzersiz Çözüm, Tüm Önemli Trend Özellikleriyle Tek Bir Araç İçinde Yerleştirildi! Forex, emtialar, kripto para birimleri, endeksler ve hisse senetleri gibi tüm sembollerde/araçlarda kullanılabilen %100 yeniden boyamayan çoklu zaman çerçevesi ve Çoklu para birimi göstergesidir. Trend Screener, grafikte noktalarla ok trend sinyalleri sağlayan etkili bir trend trend göstergesidir. Trend analizörü göstergesinde bulunan özellikler: 1.
TakePropips Donchian Trend Pro
Eric John Pajarillaga Aldana
4.61 (18)
TakePropips Donchian Trend Pro   (MT4), Donchian Kanalı'nı kullanarak trendin yönünü otomatik olarak tespit eden ve size ticarete giriş ve çıkış sinyalleri sağlayan güçlü ve etkili bir araçtır! Bu çok işlevli gösterge, bir trend tarayıcı, ticaret sinyalleri, istatistiksel panel, tarayıcı, ticaret oturumları ve uyarı geçmişi panosu içerir. Size ticaret sinyalleri sağlamak ve çizelgeleri analiz ederek saatlerce tasarruf etmenizi sağlamak için tasarlanmıştır! Kullanım kılavuzunu ve kurulum kılavuzu
ŞU ANDA %31 INDIRIMLI !!! Yeni Başlayanlar veya Uzman Tüccarlar için En İyi Çözüm! Bu gösterge benzersiz, yüksek kaliteli ve uygun fiyatlı bir ticaret aracıdır çünkü bir dizi tescilli özellik ve gizli bir formül ekledik. Yalnızca BİR grafikle 28 döviz çiftinin tümü için Uyarılar verir. Yeni bir trendin veya scalping fırsatının tam tetik noktasını belirleyebildiğiniz için ticaretinizin nasıl gelişeceğini hayal edin! Yeni temel algoritmalar üzerine inşa edilen bu sistem, potansiyel işlemler
Şu anda %20 İNDİRİMLİ! Herhangi bir Acemi veya Uzman Tüccar için En İyi Çözüm! Bu gösterge paneli yazılımı 28 döviz çifti üzerinde çalışıyor. Ana göstergelerimizden 2'sine (Gelişmiş Para Birimi Gücü 28 ve Gelişmiş Para Birimi Dürtüsü) dayanmaktadır. Tüm Forex piyasasına harika bir genel bakış sağlar. Gelişmiş Para Birimi Gücü değerlerini, para birimi hareket hızını ve tüm (9) zaman dilimlerinde 28 Forex çifti için sinyalleri gösterir. Trendleri ve / veya scalping fırsatlarını belirlemek içi
Ultimate Sniper Dashboard
Hispraise Chinedum Abraham
4.85 (27)
İndirimli fiyatı 299$! Fiyatlar gelecekte artabilir! Aşağıdaki açıklamayı okuyun! Ultimate Sniper Dashboard için En İyi Giriş Sistemi: NIHAI DINAMIK SEVIYELER. (Lütfen Ürünlerimi Kontrol Edin) Ultimate Sniper Dashboard, MT4 çoklu para birimi test limitleri nedeniyle SADECE canlı piyasalarda çalışır. Ultimate-Sniper Dashboard ile tanışın! Hem HA-Sniper hem de MA-Sniper içeren en iyimiz. ve birçok özel mod. Ultimate Sniper Dashboard mutlak bir canavar! Herhangi bir Acemi veya Uzman Tüccar
RelicusRoad Pro
Relicus LLC
4.73 (141)
Şimdi 147 $ (birkaç güncellemeden sonra 499 $ 'a yükseliyor) - Sınırsız Hesaplar (PC'ler veya Mac'ler) RelicusRoad Kullanım Kılavuzu + Eğitim Videoları + Özel Discord Grubuna Erişim + VIP Durumu PİYASAYA BAKMAK İÇİN YENİ BİR YOL RelicusRoad, forex, vadeli işlemler, kripto para birimleri, hisse senetleri ve endeksler için dünyanın en güçlü ticaret göstergesidir ve yatırımcılara kârlı kalmaları için ihtiyaç duydukları tüm bilgileri ve araçları sağlar. Başlangıç ​​seviyesinden ileri seviyey
How to use Pair Trading Station Pair Trading Station is recommended for H1 time frame and you can use it for any currency pairs. To generate buy and sell signal, follow few steps below to apply Pair Trading Station to your MetaTrader terminal. When you load Pair Trading Station on your chart, Pair Trading station will assess available historical data in your MetaTrader platforms for each currency pair. On your chart, the amount of historical data available will be displayed for each currency pai
Advanced Supply Demand
Bernhard Schweigert
4.9 (314)
CURRENTLY 26% OFF !! Best Solution for any Newbie or Expert Trader! This indicator is a unique, high quality and affordable trading tool because we have incorporated a number of proprietary features and a new formula. With this update, you will be able to show double timeframe zones. You will not only be able to show a higher TF but to show both, the chart TF, PLUS the higher TF: SHOWING NESTED ZONES. All Supply Demand traders will love it. :) Important Information Revealed Maximize the potenti
XQ Indicator MetaTrader 4
Marzena Maria Szmit
3.67 (3)
Step into the realm of Forex trading with confidence and precision using XQ, a cutting-edge Forex indicator designed to elevate your trading game to unprecedented heights. Whether you're a seasoned trader or just stepping into the world of currency exchange,   XQ Forex Indicator   empowers you with the insights and signals needed to make informed trading decisions. The signal conditions are a combination of three indicators, and XQ Forex Indicator only display  medium and long-term trends . The
IX Power MT4
Daniel Stein
5 (6)
IX Power nihayet FX Power'ın rakipsiz hassasiyetini Forex dışı sembollere getiriyor. En sevdiğiniz endeksler, hisse senetleri, emtialar, ETF'ler ve hatta kripto para birimlerindeki kısa, orta ve uzun vadeli eğilimlerin yoğunluğunu doğru bir şekilde belirler. Terminalinizin sunduğu her şeyi analiz edebilirsiniz. Deneyin ve işlem yaparken zamanlamanızın nasıl önemli ölçüde iyileştiğini deneyimleyin. IX Power Temel Özellikler 100 hassas, yeniden boyanmayan hesaplama sonuçları - terminalini
Apollo Fiyat Hareket Sistemi, tamamen Fiyat Hareketi ilkesine dayalı bir göstergedir. Gösterge, göstergenin stratejisine göre piyasaya giriş koşulları oluştuğu anda alım veya satım sinyali verir. Gösterge, temel bir ticaret sistemi olarak veya kendi ticaret sisteminize ek olarak kullanılabilir. Bu göstergenin kullanımı çok kolaydır. Sadece sinyalleri takip etmeniz gerekiyor. Gösterge, grafikteki trend çizgilerinin yanı sıra pazara giriş noktalarını ve Zarar Durdurma seviyesini gösterir. Kârı sab
Introduction to X3 Chart Pattern Scanner X3 Cherart Pattern Scanner is the non-repainting and non-lagging indicator detecting X3 chart patterns including Harmonic pattern, Elliott Wave pattern, X3 patterns, and Japanese Candlestick patterns. Historical patterns match with signal patterns. Hence, you can readily develop the solid trading strategy in your chart. More importantly, this superb pattern scanner can detect the optimal pattern of its kind. In addition, you can switch on and off individu
Fiyat tersine döndükçe ve geri çekildikçe piyasa yapısından elde edilen kâr değişir. Piyasa yapısını tersine çevirme uyarısı göstergesi, bir trendin veya fiyat hareketinin ne zaman tükenmeye yaklaştığını ve tersine dönmeye hazır olduğunu tanımlar. Genellikle bir geri dönüş veya büyük bir geri çekilme meydana gelmek üzereyken meydana gelen piyasa yapısındaki değişiklikler konusunda sizi uyarır. Gösterge, olası bir tükenme noktasının yakınında her yeni yüksek veya düşük oluştuğunda, başlangıçta
Backtest and Read Overview before purchase. Chart patterns have been a topic of debate among traders; some believe they are reliable signalers, while others do not. Our Chart Patterns All-in-One indicator displays various chart patterns to help you test these theories for yourself. The profitability of these patterns is not a reflection of the indicator's effectiveness but rather an evaluation of the patterns themselves. The Chart Patterns All-in-One indicator is an excellent tool for visualizin
Yazarın diğer ürünleri
Zigzag Zotik
Andrei Belous
5 (1)
The Zigzag Zotik indicator displays the price movement in the form of a zigzag based on the AO_Zotik indicator values. The Zigzag Zotik indicator displays the trend movements and their corrections. The AO_Zotik indicator consists of three lines moving relative to "0": "main" line; "support and resistance" line; "balance" line. The "main" line crossing the "support and resistance" line indicates the end of one wave and the beginning of the other. The Zigzag Zotik indicator displays this on the ch
Filtrele:
İnceleme yok
İncelemeye yanıt