PZ Heat Finder
- Yardımcı programlar
- PZ TRADING SLU
- Sürüm: 1.0
- Etkinleştirmeler: 20
This indicator scans all the instruments in your Market Watch and finds those offering the most volatility and efficient price movement. It will tell you what instruments are best to trade at any given time. [ Installation Guide | Update Guide | Troubleshooting | FAQ | All Products ]
- Find what symbols are hot to trade easily
- Stop missing out on trading opportunities
- Stop trading flat instruments going nowhere
- Find dozens of price action opportunities regularly
- Focus your margin on instruments which offer volatility
- Customizable font sizes and colors
Using the indicator is extremely easy:
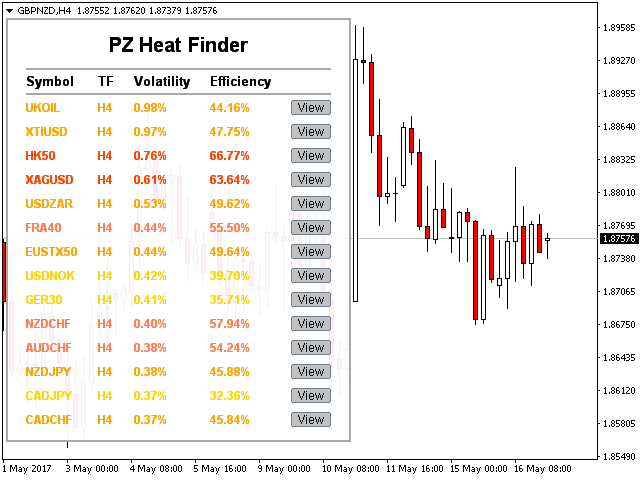
- It lists the most volatile instruments available in your platform
- It calculates how efficient is this volatility to create price movement
- Open a chart with just one click.... and trade!
The indicator reads values for the current timeframe of the chart.
How does it work
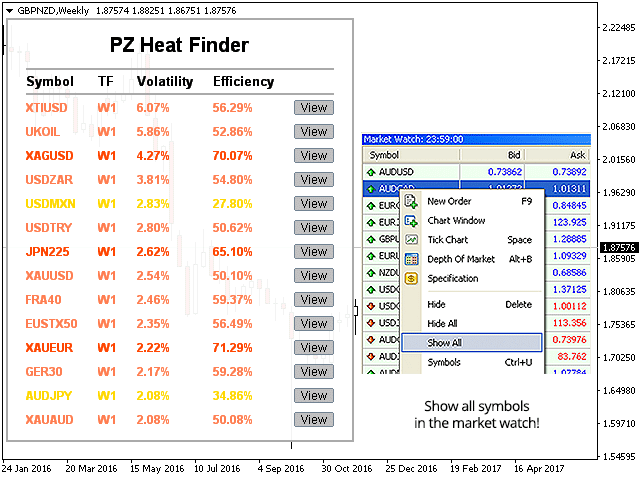
The indicator iterates all symbols present in your Market Watch, to find the most attractive to trade based on volatility and efficient price movement. To scan all the symbols your broker offers, make sure to display them all.
The indicator dashboard displays the most attractive symbols, ordered by descending volatility. The most volatile symbol at the time will be displayed at the top. But volatility alone can be deceiving: maybe an instrument is moving a lot but going nowhere. That's why the efficiency value is displayed as well.
On the other hand, a symbol with the same volatility but an efficiency of 75% is much more desireable: it means the symbol is volatile and that 75% of that volatility translates into sustained price movement.
Input Parameters
- Volatility Period - Amount of past bars to measure volatility from
- Efficiency Period - Amount of past bars to examine efficient price movement from
- Font Size for Title - Font Size for the dashboard title
- Font Size for Header - Font Size for the header row of the dashboard
- Font size for Rows - Font size for each row of the dashboard
- Number of Rows - Number of Rows to display in the dashboard
Author
Arturo López Pérez, private investor and speculator, software engineer and founder of Point Zero Trading Solutions.













Kullanıcı incelemeye herhangi bir yorum bırakmadı