ROC Signal
- Göstergeler
- Dmitriy Susloparov
- Sürüm: 1.0
- Etkinleştirmeler: 5
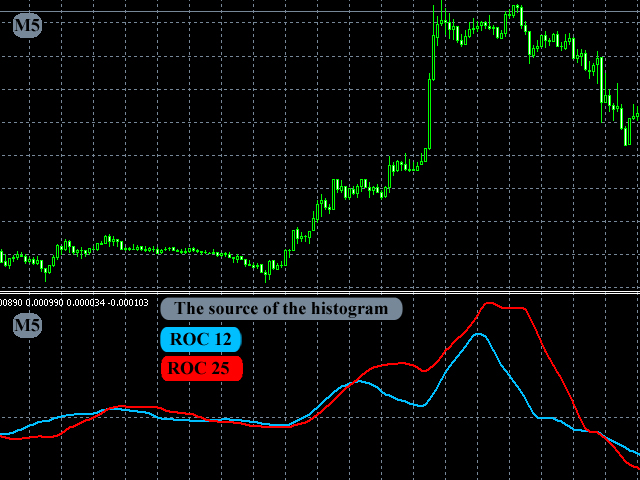
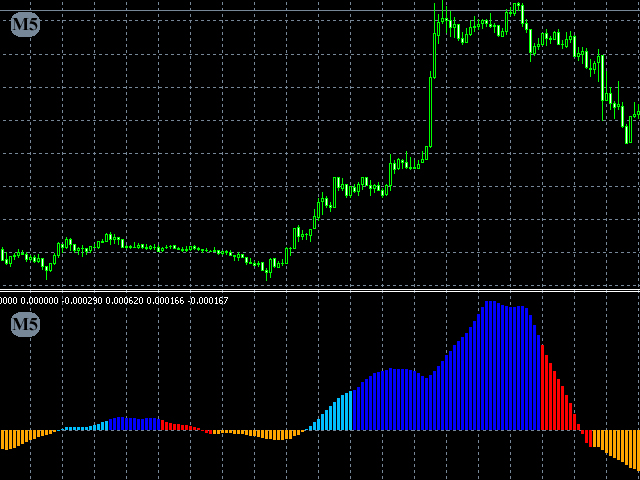
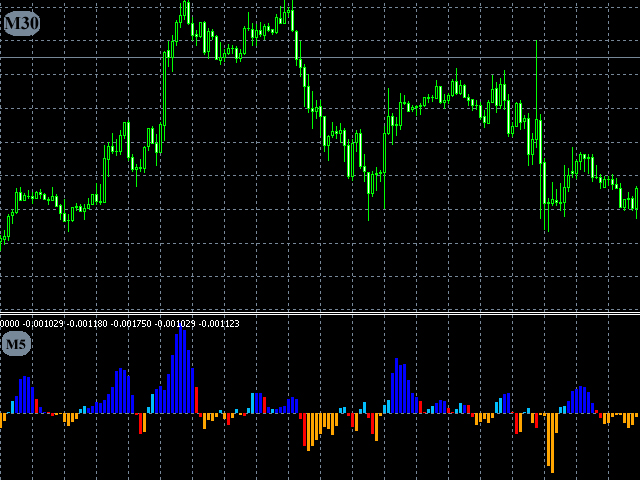
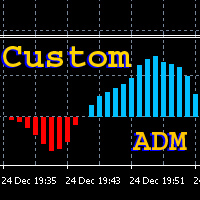
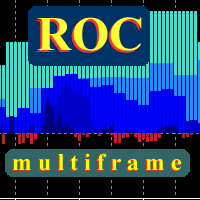
This oscillator generates trade signals based on the analysis of two smoothed Price Rate-of-Change graphs, which are calculated using different periods. One of the graphs is used as the main one, the second as the signal line. The difference between them is displayed as an oscillator in the form of a histogram, divided into four phases: the beginning of the rise, the completion of the rise, the beginning of the fall and the end of the fall.
When the color is bright blue, the ROC indicator intensively increases. This is the maximum buy signal.
When the color is dark blue, ROC has already turned in the direction of the fall, but remains positive. This should also be considered a period of price growth continuation.
Change in the color from dark blue to dark red means an explicit transition from growth to fall. This can happen even before crossing the zero mark of the ROC indicator.
Finally, a light red color indicates the end of the fall phase, when the negative pulse is exhausted, and although ROC remains below zero, it is already moving upwards.
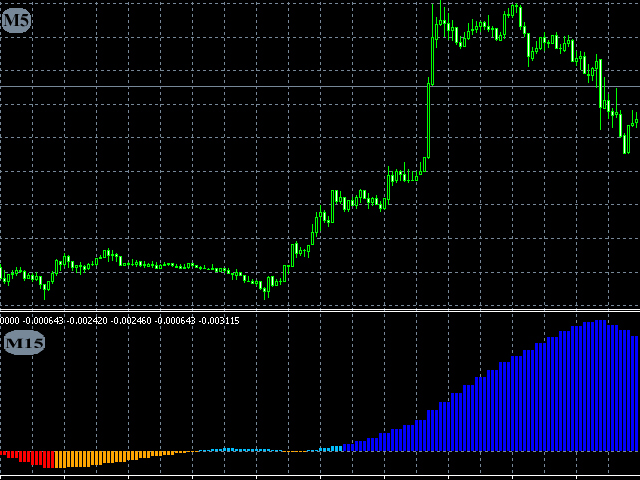
The indicator can be calculated for any timeframe, and it will be displayed in the correct time scale on the chart you trade.
Thus, you can view the situation both on the higher and smaller periods.
The indicator is tested on Just2trade
Indicator Parameters
- Period_Short - "short" period of ROC, recommended value is 12
- Period_Long - "long" period of ROC, recommended value is 25
- MA_Period - smoothing period, recommended value is 15
- TimeFrame - name of the timeframe to calculate the indicator for
