Support and Resistance
- Göstergeler
- Pavel Gotkevitch
- Sürüm: 1.2
- Güncellendi: 24 Mart 2022
- Etkinleştirmeler: 5
Support & Resistance indicator is a modification of the standard Bill Williams' Fractals indicator.
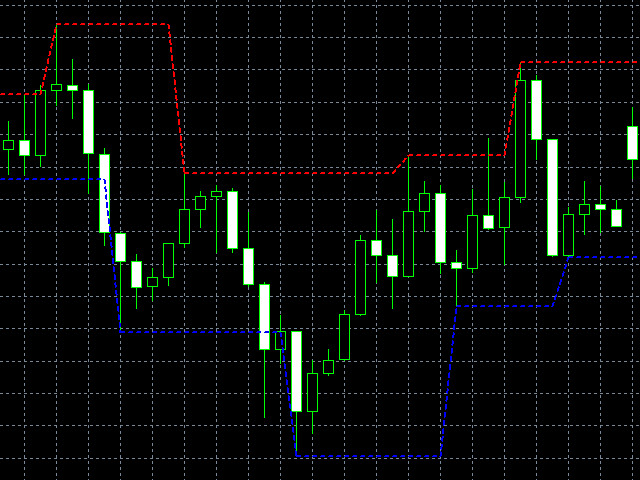
The indicator works on any timeframes. It displays support and resistance levels on the chart and allows setting stop loss and take profit levels (you can check the exact value by putting the mouse cursor over the level).
- Blue dashed lines are support level.
- Red dashed lines are resistance levels.
If you want, you can change the style and color of these lines.
If the price approaches a support level, the activity of seller decreases and the activity of buyers increases. If the price approaches a resistance level, the activity of buyers decreases and the activity of sellers increases.
Note, that when the price breaks through a support level, it may become a resistance level; and when the price breaks through a resistance level, it may become a support level.


Kullanıcı incelemeye herhangi bir yorum bırakmadı
The Support & Resistance indicator is a graphic modification of the standard Fractals indicator by Bill Williams.
Do you personally dislike Bill Williams?
Otherwise, explain and prove your inappropriate "no"!