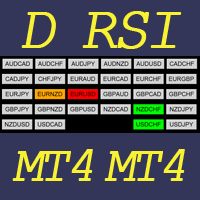
Dashboard Stochastic MT5
- Göstergeler
- Wang Yu
- Sürüm: 1.1
- Güncellendi: 25 Kasım 2021
- Etkinleştirmeler: 5
如果产品有任何问题或者您需要在此产品上添加功能,请联系我
Contact/message me if you encounter any issue using the product or need extra feature to add on the base version.
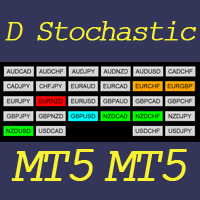
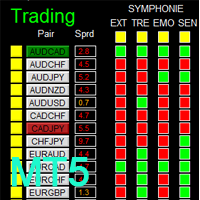
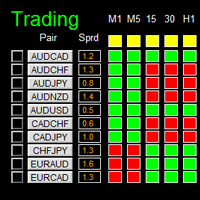
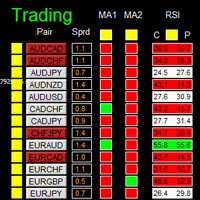
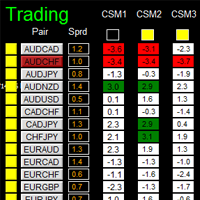
This indicator helps to visualize the Stochastic status of 28 pairs. With the feature of color panel, alert, and notification features, user can catch the potential buy and sell opportunities when the 28 main pairs cross the oversold/overbought area on one Dashboard quickly.
Dashboard Stochastic is an intuitive and handy graphic tool to help you to monitor all 28 pairs and provide trading signals based on the Stochastic Classic Rules (Overbought/Oversold and Stochastic Cross).
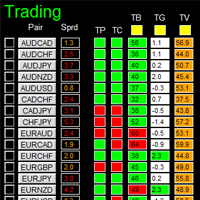
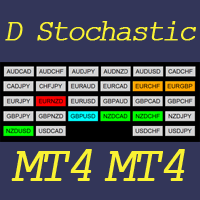
Color legend
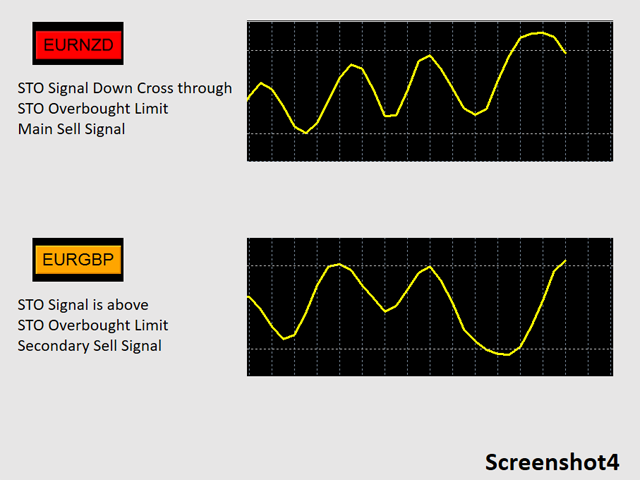
- clrOrange: Stochastic signal is above the stochastic overbought limit and Secondary Sell Signal is sent out
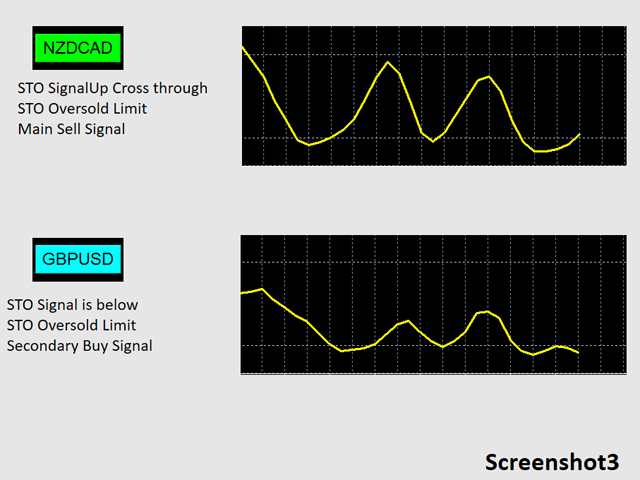
- clrAqua: Stochastic signal is below the stochastic oversold limit and Secondary Buy Signal is sent out
- clrRed: Stochastic signal is down cross stochastic overbought limit and Main Sell Signal is sent out
- clrLime: Stochastic signal is up cross stochastic oversold limit and Main Buy Signal is sent out
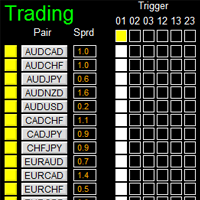
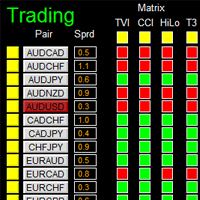
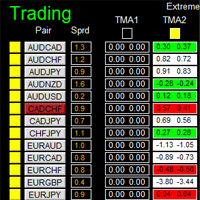
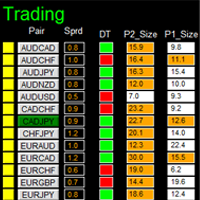
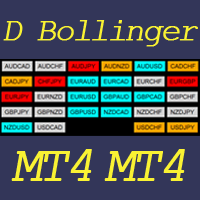
Refer to screenshot 3, and 4
Important action items before using dashboard
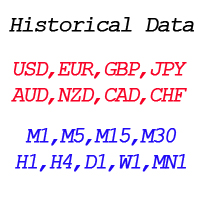
- For the first time loading Dashboard, it may take 3-5 minutes to download historical data. For subsequent loading, it only takes a few seconds.
- Make sure you have all 28 symbols in Symbol window.
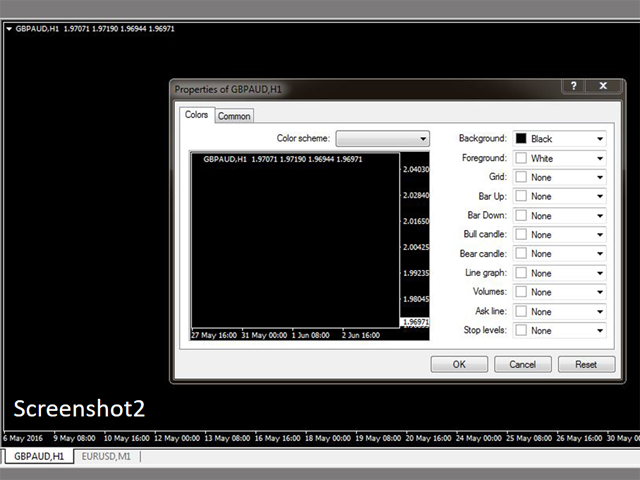
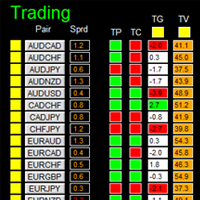
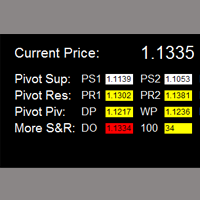
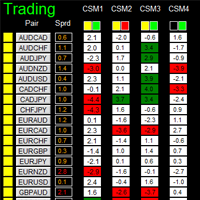
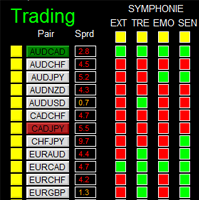
- To make your dashboard looks clear and neat, it’s better to apply the black template. Please refer to screenshot2.
Input parameters
- Send Alert upon Signal
- Send Notification upon Singal
- TimeFrame of STO
- K Period of STO
- D Period of STO
- STO Slowing
- MA Method of STO
- Applied Price of STO
- STO Overbought Limit
- STO Oversold Limit
- TimeFrame of new chart
- string usertemplate = "default"
- suffix: suffix string of your symbol. i.e.: your symbol is ‘EURUSDx’ instead of ‘EURUSD’, input ‘x’ in suffix cell, leave prefix cell blank
- prefix: prefix string of your symbol
- x_axis: dashboard x position
- y_axis: dashboard y position
Dashboard objects
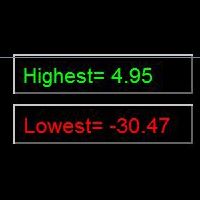
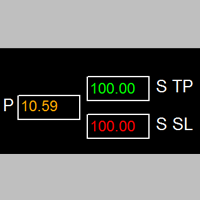
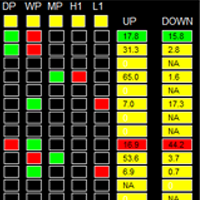
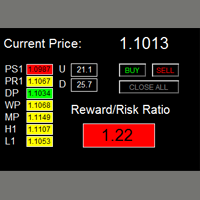
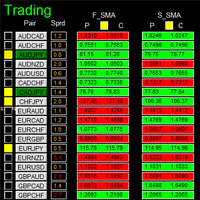
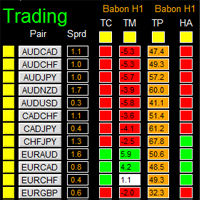
Please refer to screenshot 1,3 and 4.
Notes
Once alert/notification of a particular pair has been sent, the next alert/notification of that pair will be sent during next 5 minutes upon signal.
