FRAMA Crossing
- Göstergeler
- Pavel Gotkevitch
- Sürüm: 1.2
- Güncellendi: 24 Mart 2022
- Etkinleştirmeler: 5
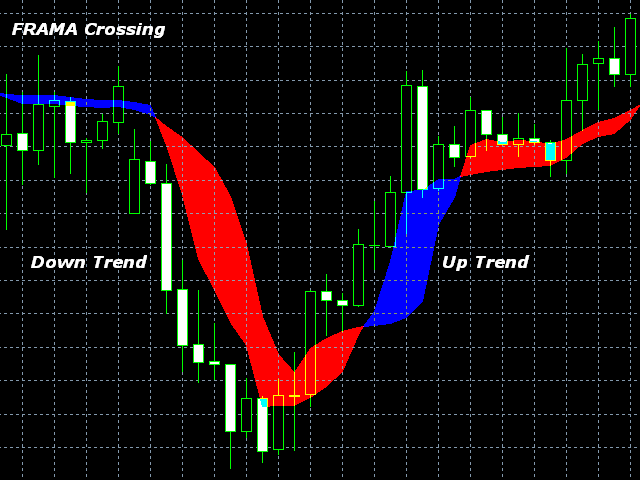
The FRAMA Crossing indicator displays on a chart two FRAMAs (Fractal Adaptive Moving Average) and paints their crossing areas in different colors – blue (buy) and red (sell).
FRAMA follows strong trend movements and slows down significantly during price consolidation.
The indicator clearly defines the trend direction and power and simplifies the perception of market signals.
The indicator can work on any timeframes may be useful in the strategies involving two moving averages' crossing method.
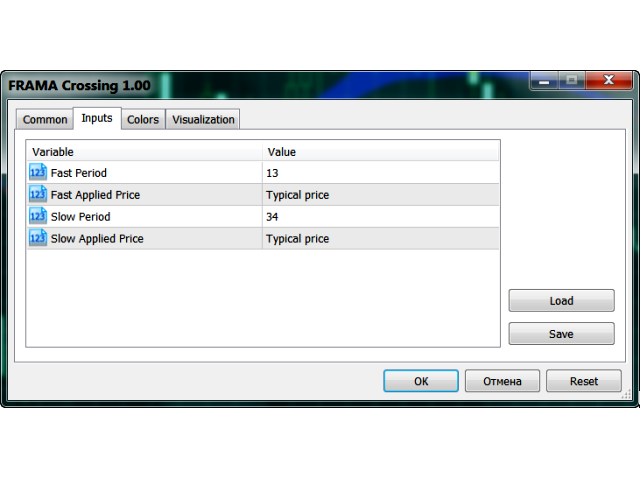
The following can be set in the indicator's Inputs tab:
- period (Fast Period, Slow Period);
- price used calculations (Close, Open, High, Low, Median, Typical, Weighted).
The color, style and width of indicator lines can be configured on the Colors tab.
Parameters
- fast period - number of bars used for fast FRAMA calculation;
- fast applied price - select from the seven applied price types for the fast FRAMA;
- slow period - number of bars used for slow FRAMA calculation;
- slow applied price - select from the seven applied price types for the slow FRAMA.






Kullanıcı incelemeye herhangi bir yorum bırakmadı