Stips
- Göstergeler
- Pavel Gotkevitch
- Sürüm: 1.3
- Güncellendi: 25 Mart 2022
- Etkinleştirmeler: 5
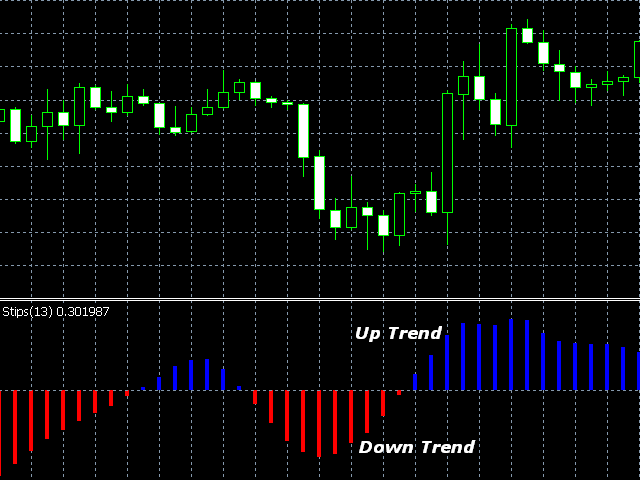
Stips is a histogram indicator that determines trend direction and strength, as well as trend changes.
The indicator can be used as a normal oscillator, i.e. analyze its trend change signals (crossing the zero line), as well as divergence and exit from overbought and oversold zones.
The indicator uses extreme prices of previous periods and calculates the ratio between the current price and extreme values.
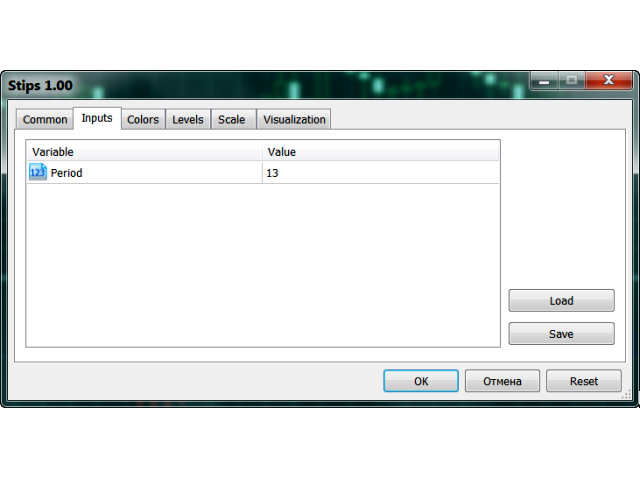
Therefore its only parameter is Period (default is 13), which sets the number of bars to determine extreme prices.
The larger the Period, the fewer there will be false signals about trend change, but indicator lagging will be larger.
The upward trend is shown as blue indicator lines, downtrend is red.
You can close a short position and open a long one when the line color changes from red to blue.
You can close a long position and open a short one when the line color changes from blue to red.
You should use a small stop loss, as lines can suddenly change their direction.
The following can be set in the indicator's Inputs tab:
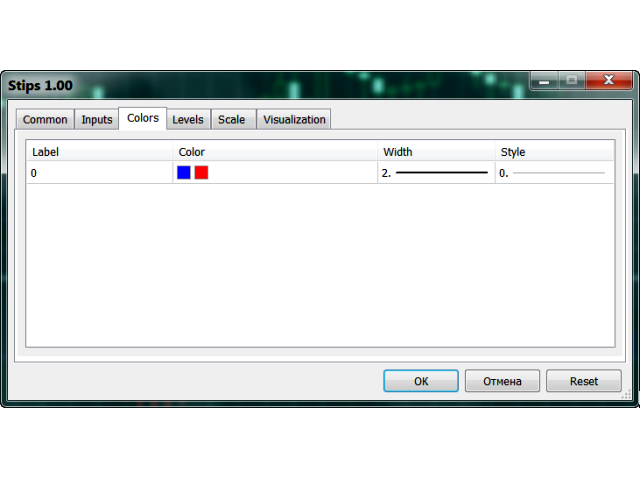
The color, style and width of indicator lines can be configured on the Colors tab.
Stips Parameters
- period - the number of bars used for the indicator calculations.







Kullanıcı incelemeye herhangi bir yorum bırakmadı