Parabolic SAR Dashboard Multi timeframe
- Göstergeler
- John Benjamin
- Sürüm: 2.0
- Güncellendi: 20 Kasım 2021
- Etkinleştirmeler: 5
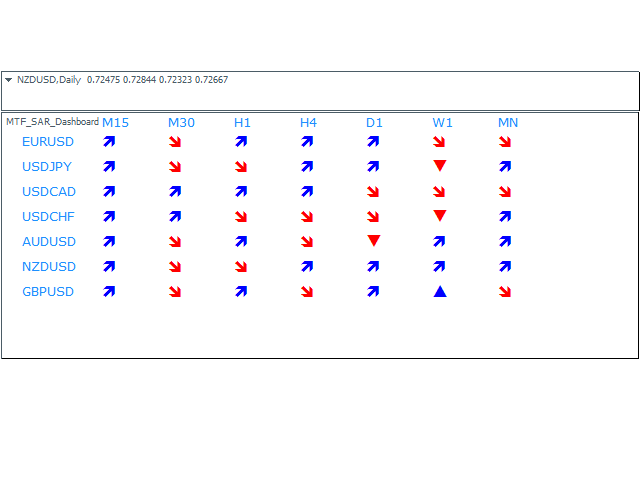
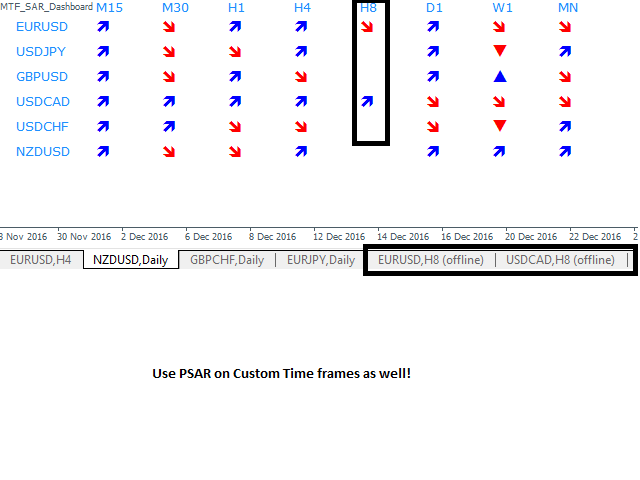
Multi-timeframe Parabolic SAR dashboard allows you to add and monitor PSAR trends. The multi-timeframe Parabolic SAR dashboard will save you a lot of time and gives you a single view of the markets using PSAR. In short, you can just view one window and get a snapshot of up to 21 instruments on your MT4 platform.
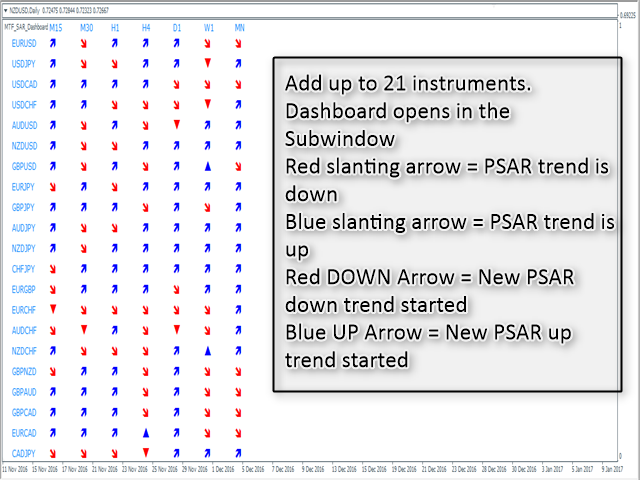
The indicator opens in a sub-window.
Below are the features of the PSAR Dashboard Indicator
- Modify PSAR Settings: The PSAR Dashboard comes with default PSAR settings of 0.02 (Step) and 0.2 (Maximum)
- Monitor 9 default time frames: From M1 - MN time frames
- Add custom time frames (using MT4 period convertor script): H2, H3, H6, H8, H12, D2, D3, etc....
- Monitor 21 instruments simultaneously
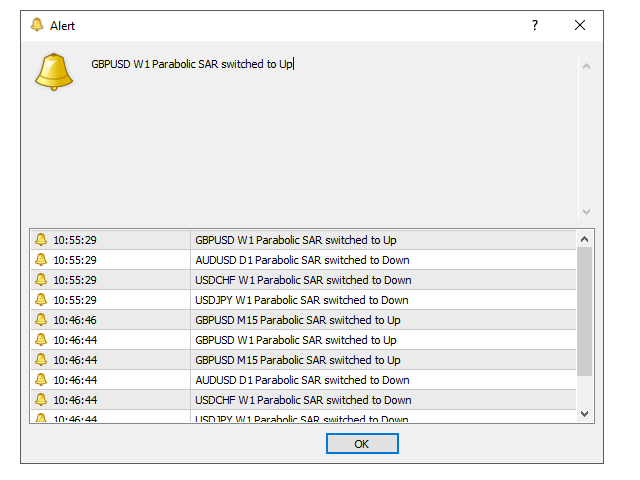
- Set up different options for alerts (pop up/email/sound)
- Blue UP Arrow = New PSAR uptrend started on the timeframe
- Red DOWN Arrow = New PSAR downtrend started on the timeframe
- Red Sloping Arrow = PSAR downtrend in progress
- Blue Sloping Arrow = PSAR uptrend in progress
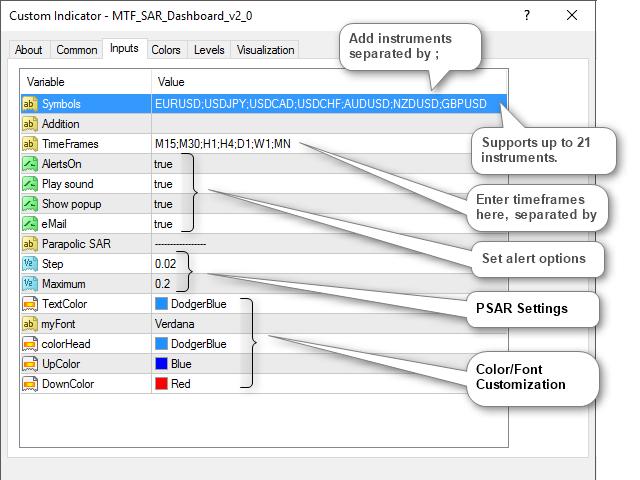
Indicator Setting Description
- Symbols: Add up to 21 symbols separated by a semi-colon; (ex: EURUSD;USDJPY)
- Addition: If there are some extensions you add here (ex: If your symbols are EURUSDm, then in Addition you enter m)
- Timeframes: Enter the timeframes for which you want to track the PSAR separated by semi-colon ;
- Alerts On: Toggle True/False to enable/disable alerts
- Play Sound: Toggle True/False to enable/disable sound alert
- Show popup: Toggle True/False to show or hide pop up
- eMail: Toggle True/False to send email notifications
- Step: 0.02 (default PSAR setting)
- Maximum: 0.2 (default PSAR setting)
- TextColor: Change text colors
- myFont: Change fonts
- colorHead: Change text colors of the headings
- UpColor: Color to show when PSAR is up or changes trend to up
- DownColor: Color to show when PSAR is down or changes trend to down















it work, thank u