• Genel bakış
  • İncelemeler (23)
  • Yorumlar (160)
  • Yenilikler

Zup Universal ZigZag with Pesavento Patterns

4.56

The ZUP is based on two ideas.

  • Idea 1 - combine a variety of methods for identifying extremums (minimums and maximums) on the market price charts in a single indicator.
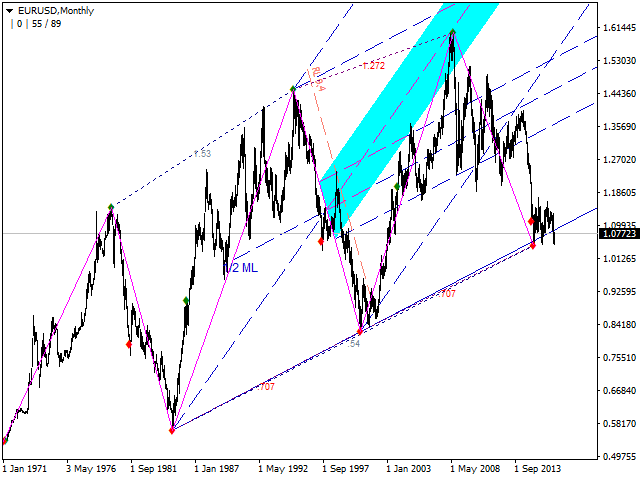
  • Idea 2 - make it possible to easily bind various graphical tools, which allow to analyze the market behavior, to the identified extremums.

To implement the first idea, the following has been made in the indicator.

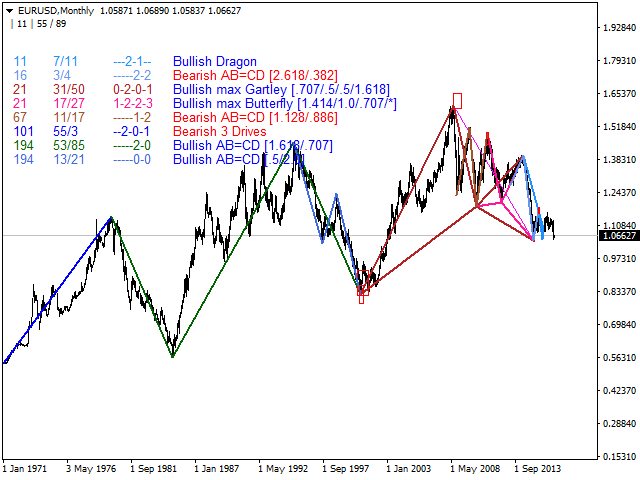
Included multiple ZigZag algorithms.

Standard ZIGZAG algorithm. The basis of this algorithm is taken from the ZigZag that comes with the MetaTrader terminal.

  • ZIGZAG by Alex. Nickname on the forum is ANG...
  • ZIGZAG similar to one built into the Canadian Ensign program.
  • ZIGZAG developed by a programmer with the nickname tauber.
  • ZIGZAG corresponding to the Gann swings. The algorithm description is provided in the book by Hyerczyk.

Five DT-ZigZag modes. The DT-ZigZag name has been invented by a programmer with the nickname klot.

The main idea is to plot the zigzags on the current timeframe based on the data from the timeframes higher relative to the current one.

  • DT-ZigZag with the standard zigzag algorithm.
  • DT-ZigZag with the algorithm developed by klot.
  • DT-ZigZag with the algorithm developed by Candid.
  • DT-ZigZag based on fractal searching algorithm. In this particular case, the fractals have nothing to do with Benoit Mandelbrot. The name is taken from the corresponding indicator in the MetaTrader package.
  • DT-ZigZag with the Gann swings in the interpretation by Hyerczyk.
  • 7 different ZigZag algorithms in market scanning mode to search for patterns, codenamed Gartley Patterns.
  • ZIGZAG developed by a programmer with the nickname Talex.
  • SQZZ ZigZag, developed by a programmer with the nickname tovaroved (Alexander Shchukin).
  • ZZ_2L developed by a programmer with the nickname wellx.
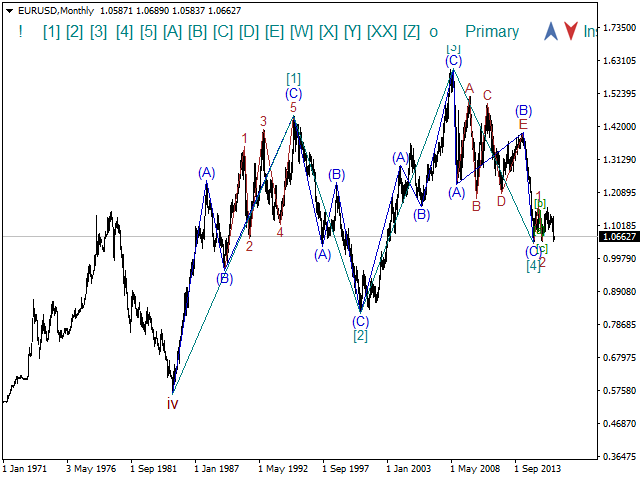
  • Wave ZigZag. This ZigZag allows to manually create a wave layout corresponding to the Elliott waves on 10 wave levels.

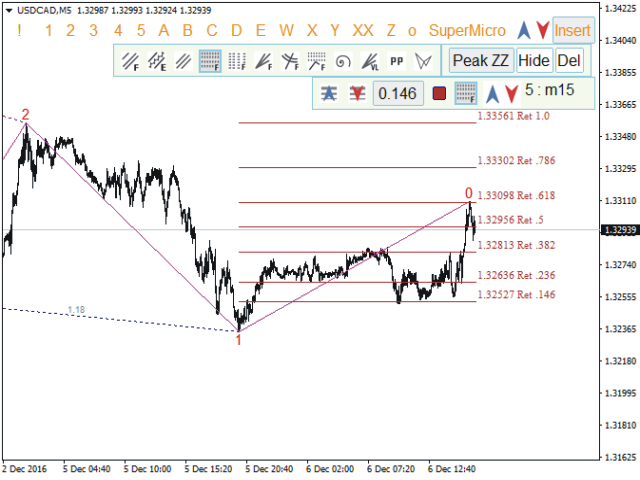
To implement the second idea, multiple graphical tools have been included in the indicator.

The indicator contains over 400 parameters in total.

All of the indicator parameters are divided into 16 groups to make navigation easier.

  1. Parameters for managing the built-in ZigZags
  2. Parameters for managing the Fibonacci levels
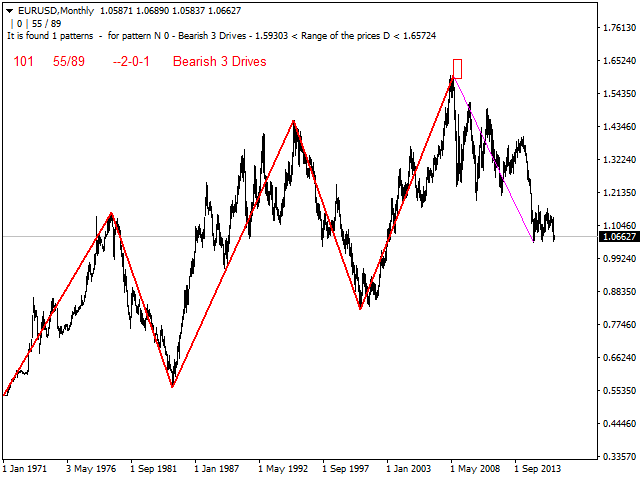
  3. Parameters for managing the Pesavento Patterns
  4. Parameters for managing the Gartley Patterns
  5. Parameters for managing the Andrews' Pitchfork
  6. Parameters for managing the micmed's channels
  7. Parameters for managing the Fibonacci fans
  8. Parameters for managing the Fibonacci extensions
  9. Parameters for managing the versum's levels
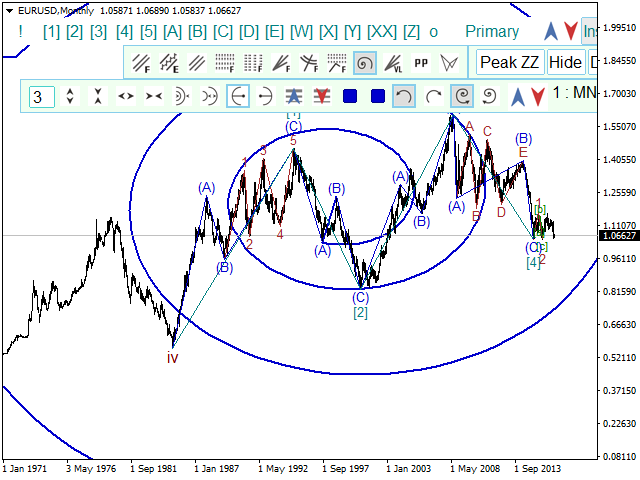
  10. Parameters for managing the Fibonacci arcs
  11. Parameters for managing the logarithmic spiral
  12. Parameters for managing the Pivot ZigZag
  13. Parameters for managing the channels
  14. Parameters for managing the Fibonacci time zones
  15. Additional Parameters
  16. General Parameters

It is also possible to manage the graphical tools using the mouse and the graphical interface.

In order to use the graphical interface, it is necessary to enable the parameter ExtPanel=true.

If the panel is deleted using the ESC key, it can be restored to the chart using the SHIFT-Z key combination.

The graphical tools drawn using the mouse are binded either to the ZigZag extremums or to the wave layout.

The graphical tools drawn using the parameters are only binded to the ZigZag extremums.

They cannot be binded to the wave layout.

By default, the use of the graphical interface is enabled. For the operation to be correct, it is necessary to use MetaTrader 4 build 1014 or higher.

For the automatic search for the Gartley patterns using the parameters, it is necessary to enable ExtIndicator = 11: search Patterns

For the automatic plotting of the Andrews’ Pitchfork using the parameters, it is necessary to enable

  • ExtPitchforkDynamic = 2
  • ExtPitchforkStatic = 2

The detailed description of all parameters and methods for working with the graphical interface takes up multiple articles.

The full list of parameters is provided in the comments. The attached file contains the brief description of the ZUP.

I express my gratitude to all who participated in the creation of the ZUP.

İncelemeler 23
Michele Manenti
688
Michele Manenti 2022.04.25 13:21 
 

Great and powerful analysis tool to predict the movements of a cross currency, after some difficulty I managed to understand and use it, it is not easy to approach but I assure that it is worth losing time and study the operation, you get very reliable and accurate results. Congratulations to the developer, we hope to see updates in the future. Thanks

Richard Shoemake
24
Richard Shoemake 2021.04.11 03:49 
 

I would expect it to work right out of the box. It doesnt seem to work unless you set some things up. I'm still trying to get around to going through your links to make sure it's set up correctly. So, far I give it at most a 3. I may revise it lower if I can't get it to work. - I've updated my rating to 5 stars because I got good support from you guys, and it's working as expected now. Thanks again!

Fawkes7k
84
Fawkes7k 2020.05.28 12:31 
 

Один из редчайших индикаторов который действительно стоит своих денег, а цена сильно занижена. Видна колоссальная и многолетняя работа по разработке улучшению оптимизации и поддержке данного индикатора. Автору огромный респект, он явно мастер своего дела.

Önerilen ürünler
TrendPlus
Sivakumar Subbaiya
4 (13)
Trend Plus   Trendplus  Indicator   Time Frame: Suitable for any time frame.  Purpose: Trend Prediction. Blue and red candle indicate the buy and sell call respectively. Buy: When the blue candle is formed buy call is initiated. close the buy trades when the next red candle will formed.   Sell: When the Red candle is formed Sell call is initiated. close the Sell trades when the next blue candle will formed.   Happy trade!!
FREE
Market Profile 3
Hussien Abdeltwab Hussien Ryad
3 (2)
Market Profile 3 MetaTrader 4 indicator  — is a classic Market Profile implementation that can show the price density over time, outlining the most important price levels, value area, and control value of a given trading session. This indicator can be attached to timeframes between M1 and D1 and will show the Market Profile for daily, weekly, monthly, or even intraday sessions. Lower timeframes offer higher precision. Higher timeframes are recommended for better visibility. It is also possible t
FREE
Candle GAP
Thushara Dissanayake
3 (1)
Mum GAP   göstergesi, haftanın her günü için mum boşluklarını otomatik olarak belirlediğinden,   Boşluk Ticareti Stratejilerini   kullanan tacirler için önemli bir araçtır. Boşluk, art arda iki günün kapanış ve açılış arasındaki fiyat seviyesi farkını ifade eder. Bu gösterge dört tür boşluk modelini tanır: Ortak, Koparma, Devam ve Tükenme. Tüccarlar, bu göstergeyi herhangi bir tabloya dahil ederek sinyallerini doğrulayabilir ve alım satım kararlarını geliştirebilir. Mum GAP göstergesinin temel ö
FREE
The indicator allows you to trade binary options. The recommended time frame is М1 and the expiration time is 1,2,3 minutes. The indicator suitable for auto and manual trading. A possible signal is specified as a arrows above/under a candle. You should wait until the candle closes! Arrows are not re-painted Trade sessions: TOKYO section (Half-end) Currency pairs: USD/JPY Working time frame: M1 Expiration time: 1,2,3 minutes. The indicator also shows good results when using the martingale strateg
FREE
Rainbow MT4 is a technical indicator based on Moving average with period 34 and very easy to use. When price crosses above MA and MA changes color to green, it’s a signal to buy. When price crosses below MA and MA changes color to red, it’s a signal to sell. The Expert advisor ( Rainbow EA MT4) based on Rainbow MT4 indicator, as you can see in the short video below is now available here .
FREE
Are you tired of drawing trendlines every time you're analyzing charts? Or perhaps you would like more consistency in your technical analysis. Then this is for you. This indicator will draw trend lines automatically when dropped on a chart. How it works Works similar to standard deviation channel found on mt4 and mt5. It has 2 parameters: 1. Starting Bar 2. Number of bars for calculation The   starting bar   is the bar which drawing of the trend lines will begin, while the   number of bars for c
FREE
Pin Bars
Yury Emeliyanov
5 (2)
Temel amaç: "Pin Çubukları", finansal piyasa grafiklerindeki pin çubuklarını otomatik olarak algılamak için tasarlanmıştır. Bir pim çubuğu, karakteristik bir gövdeye ve uzun bir kuyruğa sahip, bir trendin tersine çevrilmesini veya düzeltilmesini işaret edebilen bir mumdur. Nasıl çalışır: Gösterge, grafikteki her mumu analiz ederek mumun gövdesinin, kuyruğunun ve burnunun boyutunu belirler. Önceden tanımlanmış parametrelere karşılık gelen bir pim çubuğu algılandığında, gösterge, pim çubuğunun y
FREE
This indicator alerts you when/before new 1 or 5 minute bar candle formed. In other words,this indicator alerts you every 1/5 minutes. This indicator is especially useful for traders who trade when new bars formed. *This indicator don't work propery in strategy tester.Use this in live trading to check functionality. There is more powerful Pro version .In Pro version,you can choose more timeframe and so on. Input Parameters Alert_Or_Sound =Sound ----- Choose alert or sound or both to notify y
FREE
Extremum Reverse Bar
Yurij Izyumov
2.8 (5)
This indicator has been created for finding the probable reversal points of the symbol price. A small candlestick reversal pattern is used it its operation in conjunction with a filter of extremums. The indicator is not redrawn! If the extremum filter is disabled, the indicator shows all points that have a pattern. If the extremum filter is enabled, the condition works – if the history Previous bars 1 candles back contains higher candles and they are farther than the Previous bars 2 candle, such
FREE
Pips forex - is a ready trading system . This indicator shows with arrows on the chart when and in what direction you need to open an order. If the arrow is green, then we open a buy deal, and if the arrow is red, then we open a sell deal. Everything is very simple and quite effective. TakeProfit set 15-25 points. StopLoss set at the level of points. When the dots move, we immediately override the StopLoss. Recommended timeframe for trading M1 and M5. This is a scalping strategy and works best
Predictor PRO MT4
Evgenii Aksenov
5 (2)
A new generation PROgressive indicator from INFINITY. Predictor PRO uses its own entry and exit calculation strategy. Indicator without redrawing signals! This is very important for real trading. The indicator can be used for any currency pairs, metals, cryptocurrencies or indices. The best time of the H1 chart. Unlike other indicators, Predictor PRO shows shows the Buy/Sell entry point and the Close exit point. Calculating the profit of all signals in points on the panel helps to choose the
FREE
MegaTrends
Sivakumar Subbaiya
1 (1)
Megatrends  Indicator   Time Frame: Suitable for any time frame.  Purpose: Trend Prediction. Blue and red color indicate the buy and sell call respectively. Buy: When the blue line is originating it is opened buy call. Sell: When the Red line is origination it is opened sell call Happy trade!! this indicator is suitable for all time frame, but our recommended time frame to use 1hour and 4 hours, suitable for any chart.
FREE
Discover the power of precision and efficiency in your trading with the " Super Auto Fibonacci " MT4 indicator. This cutting-edge tool is meticulously designed to enhance your technical analysis, providing you with invaluable insights to make informed trading decisions. Key Features: Automated Fibonacci Analysis: Say goodbye to the hassle of manual Fibonacci retracement and extension drawing. "Super Auto Fibonacci" instantly identifies and plots Fibonacci levels on your MT4 chart, saving you tim
FREE
OrderBlock TS Roman
Vladislav Vlastovskii
3.8 (5)
Индикатор строит блоки заказов (БЗ) по торговой системе (ТС) Романа. Поиск блоков осуществляется одновременно на двух таймфремах: текущем и старшем (определяемым в настройках). Для оптимизации и игнорирования устаревших блоков в настройках задается ограничение количества дней в пределах которых осуществляется поиск блоков. Блоки строятся по правилам ТС состоящем из трех шагов: какую свечу вынесли (что?); какой свечой вынесли (чем?); правило отрисовки (как?).
FREE
This indicator scans for you up to 30 trading instruments and up to 8 timeframes for occurrences of the high probability reversal patterns: Double Tops/Bottoms with fake breakouts . Please read also the blog post " Professional Trading With Double Tops/Bottoms And Divergences! " which explains the concepts behind the ULTIMATE Double Top/Bottom indicator and how you can use a professional top-down approach. This FREE Version of the Scanner scans only EURUSD and GBPUSD. The full version of the sca
FREE
Toby Strategy Indicator
Ahmd Sbhy Mhmd Ahmd ʿYshh
The indicator rely on The Toby strategy >> The mother candle which is bigger in range than the previous six candles. A vertical line shows the last Toby Candle with the targets shown up and down. The strategy is about the closing price out of the range of the toby candle to reach the 3 targets..The most probable to be hit is target1 so ensure reserving your profits and managing your stop lose.
FREE
MASi Three Screens
Aleksey Terentev
5 (2)
MASi Three Screens is based on the trading strategy by Dr. Alexander Elder. This indicator is a collection of algorithms. Algorithms are based on the analysis of charts of several timeframes. You can apply any of the provided algorithms. List of versions of algorithms:     ThreeScreens v1.0 - A simple implementation, with analysis of the MACD line;     ThreeScreens v1.1 - A simple implementation, with analysis of the MACD histogram;     ThreeScreens v1.2 - Combines the first two algorithms in
FREE
UPD1 X00 Levels
Vitaliy Kuznetsov
5 (8)
Gösterge, grafikte yuvarlak seviyeleri gösterir. Bunlara psikolojik, banka veya ana oyuncu seviyeleri de denir. Bu seviyelerde boğalar ve ayılar arasında gerçek bir mücadele vardır, birçok emir birikir ve bu da oynaklığın artmasına neden olur. Gösterge, herhangi bir enstrümana ve zaman dilimine otomatik olarak ayarlanır. 80 seviyesi kırılır ve ardından test edilirse, satın alın. 20 seviyesi kırılır ve ardından test edilirse, satış yapın. Hedef 00'dır. Dikkat! Güçlü destek ve direnç seviyeleri n
FREE
Follow The Line
Oliver Gideon Amofa Appiah
4.07 (14)
FOLLOW THE LINE GET THE FULL VERSION HERE: https://www.mql5.com/en/market/product/36024 This indicator obeys the popular maxim that: "THE TREND IS YOUR FRIEND" It paints a GREEN line for BUY and also paints a RED line for SELL.  It gives alarms and alerts of all kinds. IT DOES NOT REPAINT and can be used for all currency pairs and timeframes. Yes, as easy and simple as that. Even a newbie can use it to make great and reliable trades. NB: For best results, get my other premium indicators for more
FREE
Wise Men Indicator demo
Bohdan Kasyanenko
3 (2)
The indicator displays signals according to the strategy of Bill Williams on the chart. Demo version of the indicator has the same features as the paid, except that it can work only on a demo account . Signal "First Wise Man" is formed when there is a divergent bar with angulation.  Bullish divergent bar - with lower minimum and closing price in the upper half. Bearish divergent bar - higher maximum and the closing price at the bottom half. Angulation is formed when all three lines of Alligator
FREE
Free automatic Fibonacci is an indicator that automatically plots a Fibonacci retracement based on the number of bars you select on the BarsToScan setting in the indicator. The Fibonacci is automatically updated in real time as new highest and lowest values appears amongst the selected bars. You can select which level values to be displayed in the indicator settings. You can also select the color of the levels thus enabling the trader to be able to attach the indicator several times with differe
FREE
Head and Shoulders Pattern Indicator - Your Key to Recognizing Trend Reversals Unlock the power of pattern recognition with the "Head and Shoulders Pattern Indicator." This cutting-edge tool, designed for MetaTrader, is your trusted ally in identifying one of the most powerful chart patterns in technical analysis. Whether you're a novice or an experienced trader, this indicator simplifies the process of spotting the Head and Shoulders pattern, allowing you to make informed trading decisions. Key
FREE
"Turbo Helper for scalping" is a fully prepared trading system. It shows the trader with an arrow on the chart when to open an order and in which direction. It also indicates to the trader with a square symbol when to close the trade. After that, the indicator displays the estimated number of points for the trade on the chart. This value may vary slightly as the indicator does not take into account the actual spread size and swap of your broker. However, to calculate more accurately, you can spe
Fx BFP Pivot Points
Maged Ait Abbi
5 (5)
A forex   pivot point   strategy could very well be a trader’s best friend as far as identifying levels to develop a bias, place stops and identify potential profit targets for a trade. Pivot points have been a go-to for traders for decades. The basis of pivot points is such that price will often move relative to a previous limit, and unless an outside force causes the price to do so, price should stop near a prior extreme. Pivot point trading strategies vary which makes it a versatile tool for
FREE
Scalping indicator. It takes into account volatility, price movement in the local interval and the direction of the current trend. Recommended timeframe - M5. Advantages: Low volatility when a signal appears ensures minimal movement against an open position. The indicator does not redraw its signals. There are alert signals. It is a great tool for day trading. Settings: Name Description Period Indicator period Range of each bar in the period (pp.) The maximum size of each candle in the indicato
FREE
Pivot Point Fibo RSJ, Fibonacci oranlarını kullanarak günün destek ve direnç çizgilerini izleyen bir göstergedir. Bu muhteşem gösterge, Fibonacci oranlarını kullanarak Pivot Point üzerinden 7 seviyeye kadar destek ve direnç oluşturur. Fiyatların, bir operasyonun olası giriş/çıkış noktalarını algılamanın mümkün olduğu bu destek ve direncin her bir düzeyine uyması harika. Özellikleri 7 seviyeye kadar destek ve 7 seviye direnç Seviyelerin renklerini ayrı ayrı ayarlayın Girişler Pivot Tipi Pivo
FREE
Cumulative Delta MT4
Evgeny Shevtsov
4.93 (28)
The indicator analyzes the volume scale and splits it into two components - seller volumes and buyer volumes, and also calculates the delta and cumulative delta. The indicator does not flicker or redraw, its calculation and plotting are performed fairly quickly, while using the data from the smaller (relative to the current) periods. The indicator operation modes can be switched using the Mode input variable: Buy - display only the buyer volumes. Sell - display only the seller volumes. BuySell -
FREE
This is a Sharkfin Arrows Indicator. Detailed explanation and TDI extras: https://www.mql5.com/en/blogs/post/759138 This indicator will show only Arrows. It does not have TDI symbols on chart. Please get the extras from links above for TDI indicators. Sharkfin Scanner (paid): https://www.mql5.com/en/market/product/123566 TDI Scanner Dash (paid): https://www.mql5.com/en/market/product/41826 About: This Indicator finds the Shark Fin Pattern. It will show an arrow in the current bar if RSI sha
FREE
Check my paid tools they work great and I share Ea's based on them for free please r ate The Dual Timeframe RSI (Relative Strength Index) indicator is a novel trading tool that allows traders to monitor RSI readings from two different timeframes on a single chart. This dual perspective enables traders to identify potential trend confirmations and divergences more effectively. For instance, a trader might use a 1-hour RSI alongside a daily RSI to ensure that short-term trades align with the broa
FREE
QualifiedEngulfing
Ashkan Hazegh Nikrou
QualifiedEngulfing, ProEngulfing Göstergesi'nin ücretsiz sürümüdür. ProEngulfing , Advance Engulf Göstergesi'nin ücretli sürümüdür. İndirin buradan. ProEngulfing'in ücretsiz ve ücretli sürümleri arasındaki fark nedir? Ücretsiz sürümünde bir gün içinde bir sinyal kısıtlaması bulunmaktadır. QualifiedEngulfing Tanıtımı - MT4 İçin Profesyonel Engulf Deseni Göstergeniz QualifiedEngulfing ile precision gücünü serbest bırakın; forex piyasasındaki nitelikli engulf desenlerini belirlemek ve vurgulamak i
FREE
Bu ürünün alıcıları ayrıca şunları da satın alıyor
TPSpro RFI Levels
Roman Podpora
4.82 (22)
TALİMATLAR         RUS   -        ENG       Bir gösterge ile kullanılması   önerilir       -       TPSpro   TREND PRO -   Sürüm MT4         Ticarette önemli bir unsur, bir ticaret aracını satın alma veya satma kararlarının alındığı bölgeler veya seviyelerdir. Büyük oyuncuların piyasadaki varlıklarını gizleme girişimlerine rağmen, kaçınılmaz olarak izler bırakırlar. Bizim görevimiz bu izleri nasıl tanımlayacağımızı ve doğru şekilde nasıl yorumlayacağımızı öğrenmekti. Ana işlevler:: Satıcılar ve
TPSproTREND PrO
Roman Podpora
4.79 (19)
TPSpro TREND PRO,   piyasayı otomatik olarak analiz eden, trend ve değişimlerinin her biri hakkında bilgi sağlayan, ayrıca yeniden çizmeden işlemlere girme sinyalleri veren bir trend göstergesidir! Gösterge her mumu ayrı ayrı analiz ederek kullanır. farklı dürtülere atıfta bulunur - yukarı veya aşağı dürtü. Para birimleri, kripto paralar, metaller, hisse senetleri ve endeksler için işlemlere tam giriş noktaları! Sürüm MT5                   GÖSTERGENİN TAM AÇIKLAMASI       Bunu -   RFI SEVİYELERİ
Dynamic Forex28 Navigator
Bernhard Schweigert
5 (4)
Dynamic Forex28 Navigator - Yeni Nesil Forex Ticaret Aracı. ŞU ANDA %49 İNDİRİM. Dynamic Forex28 Navigator, uzun zamandır popüler olan göstergelerimizin evrimidir ve üçünün gücünü tek bir göstergede birleştirir: Gelişmiş Döviz Gücü28 Göstergesi (695 inceleme) + Gelişmiş Döviz İMPULS ve UYARI (520 inceleme) + CS28 Kombo Sinyalleri (Bonus). Gösterge hakkında ayrıntılar https://www.mql5.com/en/blogs/post/758844 Yeni Nesil Güç Göstergesi Ne Sunuyor?  Orijinallerde sevdiğiniz her şey, şimdi yeni
Scalper Inside PRO
Alexey Minkov
4.75 (60)
!!!CHRISTMAS SALE!!! An exclusive indicator that utilizes an innovative algorithm to swiftly and accurately determine the market trend. The indicator automatically calculates opening, closing, and profit levels, providing detailed trading statistics. With these features, you can choose the most appropriate trading instrument for the current market conditions. Additionally, you can easily integrate your own arrow indicators into Scalper Inside Pro to quickly evaluate their statistics and profitab
Trend Reversal – MT4'te Trend Dönüşlerini Belirlemek İçin Yardımcınız Piyasa analizinizi geliştirmek ve daha bilinçli kararlar almak için güçlü ve sezgisel bir araç mı arıyorsunuz? Trend Reversal göstergesi, MetaTrader 4 platformunda trend dönüş noktalarını doğru bir şekilde belirlemek isteyen yatırımcılar için özel olarak tasarlanmıştır. Gelişmiş algoritmalar ve kanıtlanmış tekniklerin birleşimi sayesinde, Trend Reversal, piyasadaki önemli anları tanımanıza yardımcı olmak için net ve görünür s
MTF Supply Demand Zones
Georgios Kalomoiropoulos
4.82 (22)
Yeni Nesil Otomatik Arz ve Talep Bölgeleri. Her Grafikte Çalışan Yeni ve Yenilikçi Algoritma. Tüm Bölgeler Piyasanın Fiyat Hareketine Göre Dinamik Olarak Oluşturulmaktadır. İKİ TÜR UYARI --> 1) FİYAT BİR BÖLGEYE ÇIKTIĞINDA 2) YENİ BİR BÖLGE OLUŞTURDUĞUNDA Bir tane daha işe yaramaz gösterge almazsın. Kanıtlanmış Sonuçlarla eksiksiz bir Ticaret Stratejisi elde edersiniz.     Yeni özellikler:     Fiyat Arz/Talep Bölgesine ulaştığında uyarılar     Yeni bir Arz/Talep Bölgesi oluşturulduğunda
FX Volume
Daniel Stein
4.58 (33)
FX Hacmi ile Forex'te Gerçek Bir Avantaj Elde Edin: Nihai Hacim Göstergesi FX Volume, gerçek piyasa duyarlılığını içeriden bir bakış açısıyla ortaya koyan ilk ve tek hacim göstergesidir. FX Volume, kurumsal piyasa katılımcılarının ve brokerlerin nasıl konumlandıklarına dair benzersiz bilgiler sağlayarak, genellikle büyük oyuncular için ayrılmış öngörü ile ticaret yapmanıza olanak tanır. COT raporlarının gecikmelerine elveda deyin - FX Volume size bu önemli bilgileri anında grafiğinizde sunarak
FX Power MT4 NG
Daniel Stein
5 (14)
FX Power NG'nin Tüm Gücünün Kilidini Açın: Nihai Para Birimi Güç Ölçer FX Power, sekiz yılı aşkın süredir dünya çapındaki yatırımcıları güvenilir ve hassas döviz gücü analizleriyle güçlendirmektedir. Şimdi, FX Power NG bu güvenilir aracı bir sonraki seviyeye taşıyarak, ticaretinize benzersiz doğruluk, özelleştirme ve içgörüler getiren gelişmiş özellikler sunuyor. FX Power NG'yi Ciddi Yatırımcılar İçin Olmazsa Olmaz Kılan Nedir? FX Power NG, orijinal FX Power'da sevdiğiniz her şeyi temel ekleme
TrendMaestro
Stefano Frisetti
5 (3)
note: this indicator is for METATRADER4, if you want the version for METATRADER5 this is the link:  https://www.mql5.com/it/market/product/108106 TRENDMAESTRO ver 2.4 TRENDMAESTRO recognizes a new TREND in the bud, he never makes mistakes. The certainty of identifying a new TREND is priceless. DESCRIPTION TRENDMAESTRO identifies a new TREND in the bud, this indicator examines the volatility, volumes and momentum to identify the moment in which there is an explosion of one or more of these data a
Currency Strength Exotics
Bernhard Schweigert
4.87 (31)
ŞU ANDA %20 INDIRIMLI! Herhangi bir Acemi veya Uzman Tüccar için En İyi Çözüm! Bu Gösterge, Egzotik Çiftler Emtialar, Endeksler veya Vadeli İşlemler gibi herhangi bir sembol için para birimi gücünü göstermek için uzmanlaşmıştır. Türünün ilk örneğidir, Altın, Gümüş, Petrol, DAX, US30, MXN, TRY, CNH vb. gerçek para birimi gücünü göstermek için 9. satıra herhangi bir sembol eklenebilir. Bu benzersiz, yüksek kaliteli ve uygun fiyatlı bir ticaret aracıdır çünkü bir dizi tescilli özelliği ve yeni b
Şu anda %20 İNDİRİMLİ! Herhangi bir Acemi veya Uzman Tüccar için En İyi Çözüm! Bu gösterge paneli yazılımı 28 döviz çifti üzerinde çalışıyor. Ana göstergelerimizden 2'sine (Gelişmiş Para Birimi Gücü 28 ve Gelişmiş Para Birimi Dürtüsü) dayanmaktadır. Tüm Forex piyasasına harika bir genel bakış sağlar. Gelişmiş Para Birimi Gücü değerlerini, para birimi hareket hızını ve tüm (9) zaman dilimlerinde 28 Forex çifti için sinyalleri gösterir. Trendleri ve / veya scalping fırsatlarını belirlemek için
FX Seviyelerini Keşfedin: Ticarette Başarı için Nihai Destek ve Direnç Göstergeniz FX Levels bir destek ve direnç göstergesinden daha fazlasıdır; döviz çiftleri, endeksler, hisse senetleri veya emtialar olsun, tüm ticaret sembollerinde hassasiyet, güvenilirlik ve sorunsuz işlevsellik isteyen ciddi tüccarlar için oyunun kurallarını değiştirir. Kanıtlanmış Lighthouse yöntemi üzerine inşa edilen ve dinamik, gerçek zamanlı uyarlanabilirlik ile geliştirilen FX Levels, hassas kar hedefleri belirlemek
Ticaret Seviyeleri Göstergesi, giriş noktalarını, tutma pozisyonlarını ve trend yönünü belirlemek için tasarlanmış bir ticaret sistemidir. Tek bir komplekste çalışan çeşitli mekanizmaları içerir, trend yönünün dalga analizini, sinyalleri oluştururken seviye analizini içerir, olası TP ve SL hedeflerini gösterir. Gösterge yetenekleri Mevcut mumun üzerinde sinyal okları görünür ve yeniden renklendirilmez. Fiyatın sıçradığı seviyeleri aramak için özel algoritmalar kullanır. Trendlere göre çalışır.
Ultimate Sniper Dashboard
Hispraise Chinedum Abraham
4.82 (22)
İndirimli fiyatı 299$! Fiyatlar gelecekte artabilir! Aşağıdaki açıklamayı okuyun! Ultimate Sniper Dashboard için En İyi Giriş Sistemi: NIHAI DINAMIK SEVIYELER. (Lütfen Ürünlerimi Kontrol Edin) Ultimate Sniper Dashboard, MT4 çoklu para birimi test limitleri nedeniyle SADECE canlı piyasalarda çalışır. Ultimate-Sniper Dashboard ile tanışın! Hem HA-Sniper hem de MA-Sniper içeren en iyimiz. ve birçok özel mod. Ultimate Sniper Dashboard mutlak bir canavar! Herhangi bir Acemi veya Uzman Tüccar için
Introduction to Fractal Pattern Scanner Fractal Indicator refers to the technical indicator that makes use of the fractal geometry found in the financial market. Fractal Pattern Scanner is the advanced Fractal Indicator that brings the latest trading technology after the extensive research and development work in the fractal geometry in the financial market. The most important feature in Fractal Pattern Scanner is the ability to measure the turning point probability as well as the trend probabi
MetaBands M4
Vahidreza Heidar Gholami
5 (3)
MetaBands uses powerful and unique algorithms to draw channels and detect trends so that it can provide traders with potential points for entering and exiting trades. It’s a channel indicator plus a powerful trend indicator. It includes different types of channels which can be merged to create new channels simply by using the input parameters. MetaBands uses all types of alerts to notify users about market events. Features Supports most of the channel algorithms Powerful trend detection algorith
Automated Trendlines
Georgios Kalomoiropoulos
5 (16)
Trend çizgileri, forex ticaretinde en önemli teknik analiz aracıdır. Ne yazık ki, çoğu tüccar onları doğru şekilde çizmez. Otomatik Trend Çizgileri göstergesi, piyasaların trend hareketini görselleştirmenize yardımcı olan ciddi tüccarlar için profesyonel bir araçtır. İki tür Trend Çizgisi, Boğa Trend Çizgisi ve Ayı Trend Çizgisi vardır. Yükseliş trendinde, Forex trend çizgisi, fiyat hareketinin en düşük salınım noktalarından geçer. En az iki "en düşük düşük"ü birleştirmek, bir trend çizgisi o
IX Power MT4
Daniel Stein
4.67 (6)
IX Power ile tanışın - ticaret hassasiyetinizi güçlendirmek için nihai araç! FX Power ile aynı rakipsiz doğrulukla tasarlanan IX Power, endeksler ve hisse senetlerinden emtialara, ETF'lere ve hatta kripto para birimlerine kadar her türlü işlem sembolünde uzmanlaşmanızı sağlar. Tüm favori varlıklarınızdaki kısa, orta ve uzun vadeli trendler hakkında kesin bilgilerle ticaretinizi yükseltmeye hazır olun. Neden IX Power'ı Seçmelisiniz? IX Power ile zamanlamanız keskinleşir ve daha akıllı, daha hız
TPA True Price Action indicator reveals the true price action of the market makers through 100% non-repainting signals (except early signals mode) strictly at the close of a candle! TPA shows entries and re-entries, every time the bulls are definitely stronger than the bears and vice versa. Not to confuse with red/green candles. The shift of power gets confirmed at the earliest stage and is ONE exit strategy of several. There are available now two free parts of the TPA User Guide for our custom
Advanced Supply Demand
Bernhard Schweigert
4.91 (294)
CURRENTLY 26% OFF !! Best Solution for any Newbie or Expert Trader! This indicator is a unique, high quality and affordable trading tool because we have incorporated a number of proprietary features and a new formula. With this update, you will be able to show double timeframe zones. You will not only be able to show a higher TF but to show both, the chart TF, PLUS the higher TF: SHOWING NESTED ZONES. All Supply Demand traders will love it. :) Important Information Revealed Maximize the potentia
CyberZingFx Trend Reversal
Afsal Meerankutty
4.18 (17)
NEW YEAR SPECIAL DISCOUNT RUNNING NOW 40% DISCOUNT Price slashed from $149 to $89 until 3rd Jan 2025 Indicator captures the trend reversals with no-repaint Buy and Sell Arrow signals. CyberZingFx Trend Reversal Indicator - your go-to solution for accurate and reliable trend reversal signals. With its  advanced trading strategy , the indicator offers you Buy and Sell Arrow signals that do not repaint, making it a reliable tool for catching Swing Highs and Swing Lows in any market and any time fr
The Scalper Boss indicator is a cutting-edge analytical tool designed to assess market conditions and identify optimal entry and exit points using a multi-layered logic framework. It adapts to changing market environments, providing traders with clear visual signals and trend lines. Its primary value lies in its ability to enhance market analysis by filtering noise and capturing meaningful movements, making it especially beneficial for scalping and intraday trading. While Scalper Boss does not g
Gann Swing Structure
Kirill Borovskii
5 (1)
This indicator is based on the mathematics of the great trader W.D. Ganna. With its help, you can easily find strong levels by analyzing swings to find the optimal entry point. The indicator works on all instruments and all timeframes. The indicator is fully manual and has control buttons. All you need to do is press the NEW button, a segment will appear, which you can place on any movement, swing or even 1 candle that you want to analyze. By placing the segment, press the OK button. A grid (th
TheStrat Monitor
Robert Gerald Wood
3 (2)
If you've not already learnt about The Strat trading strategy , go google it now. I promise it won't be a waste of your time, and you will likely learn some new tricks whether you use it or not. OK, so now you know what TheStrat is, you will be able to understand what this indicator can do for you. Key Features In short, the Indicator will: Show Timeframe Continuity for all supported timeframes Supports two timeset views, Day trader and Swing trader Show when Full Timeframe Continuity is in pla
This indicator is a too that : calculates position size based on account balance/equity , currency pair, given entry level, stop-loss level and risk tolerance (set either in percentage points or in base currency). It displays reward/risk ratio based on take-profit. Shows total portfolio risk based on open trades and pending orders. Calculates margin required for new position, allows custom leverage.                
Gold Venamax MT4
Sergei Linskii
5 (1)
Gold Venamax   - bu en iyi hisse senedi teknik göstergesidir. Gösterge algoritması bir varlığın fiyat hareketini analiz eder ve oynaklığı ve potansiyel giriş bölgelerini yansıtır. Gösterge özellikleri: Bu, rahat ve karlı ticaret için Magic ve iki Blok trend oku içeren süper bir göstergedir. Grafikte blokları değiştirmek için Kırmızı Düğme görüntülenir. Magic, gösterge ayarlarında ayarlanır, böylece göstergeyi farklı Blokları görüntüleyen iki grafiğe yükleyebilirsiniz. Gold Venamax farklı ok t
Arrow Micro Scalper , ölçeklendirme ve kısa vadeli ticaret için tasarlanmış, herhangi bir grafiğe ve finansal araca (Para birimleri, kripto, hisse senetleri, metaller) entegre edilmiş bir göstergedir. Çalışmasında dalga analizi ve trend yönü filtresini kullanıyor. M1'den H4'e kadar Zaman Çerçevelerinde kullanılması önerilir. Göstergeyle nasıl çalışılır. Gösterge, ayarları değiştirmek için 2 harici parametre içerir, geri kalanı zaten varsayılan olarak yapılandırılmıştır. Büyük oklar trend yönün
Currency Strength Matrix
Raymond Gilmour
4.5 (26)
THE ONLY CURRENCY STRENGTH INDICATOR THAT IS BASED ON PRICE ACTION. DESIGNED FOR TREND, MOMENTUM & REVERSAL TRADERS This indicator  reads price action to confirm trend and strength . Advanced multi-currency and multi-time frame indicator that shows you simply by looking at one chart, every currency pair that is trending and the strongest and weakest currencies driving those trends. For full details on how to use this indicator, and also how to get a FREE chart tool, please see user manual HERE
Volume by Price MT4
Brian Collard
4.6 (10)
The Volume by Price Indicator for MetaTrader 4 features Volume Profile and Market Profile TPO (Time Price Opportunity). Volume and TPO histogram bar and line charts. Volume Footprint charts. TPO letter and block marker collapsed and split structure charts. Static, dynamic and flexible range segmentation and compositing methods with relative and absolute visualizations. Session hours filtering and segment concatenation with Market Watch and custom user specifications. Graphical layering, positio
Enigmera
Ivan Stefanov
5 (3)
ENIGMERA: Pazarın çekirdeği https://www.enigmera.com Giriş Bu gösterge ve ticaret sistemi, finansal piyasalar için dikkate değer bir yaklaşımdır. ENIGMERA, destek ve direnç seviyelerini doğru bir şekilde hesaplamak için fraktal döngüleri kullanır. Gerçek birikim aşamasını gösterir ve yön ve hedefler verir.  İster bir trendde ister bir düzeltmede olalım çalışan bir sistem.  Nasıl çalışır? ENIGMERA üç çizgiden oluşur: destek/direnç çizgisi, hedef çizgisi ve sapma çizgisi. Sistem, geçmiş veriler
Yazarın diğer ürünleri
Программу можно использовать как советник для ручной и полуавтоматической торговли. Или как индикатор для выявления структуры рынка. В торговой части программы отсутствуют ордера Sell, Buy. А также лимитные и стоповые ордера. Вместо этого на график выводится торговая рамка для сделок на продажу -  SELL  или на покупку - BUY . У торговой рамки имеются три уровня. Уровень открытия будущего ордера. Уровень стопа и уровень профита. Влево от торговой рамки выводятся три линии. Перемещая данные линии
Filtrele:
allexflame4848
19
allexflame4848 2022.11.07 13:29 
 

Отличная работа ..Пожалуй самая лучшая работа , которую я встречал по тех.анализу .Работает отлично ..Спасибо автору

Leoarab
33
Leoarab 2022.09.19 21:58 
 

need alot of help to understand it. i guess template also would be helpful to have it clear.a help would be appreciated.

Michele Manenti
688
Michele Manenti 2022.04.25 13:21 
 

Great and powerful analysis tool to predict the movements of a cross currency, after some difficulty I managed to understand and use it, it is not easy to approach but I assure that it is worth losing time and study the operation, you get very reliable and accurate results. Congratulations to the developer, we hope to see updates in the future. Thanks

Richard Shoemake
24
Richard Shoemake 2021.04.11 03:49 
 

I would expect it to work right out of the box. It doesnt seem to work unless you set some things up. I'm still trying to get around to going through your links to make sure it's set up correctly. So, far I give it at most a 3. I may revise it lower if I can't get it to work. - I've updated my rating to 5 stars because I got good support from you guys, and it's working as expected now. Thanks again!

Eugeni Neumoin
6531
Geliştiriciden yanıt Eugeni Neumoin 2021.04.20 08:54
Write what you need to configure. Everyone using ZUP has different requests. If you set it up for all requests, then the graph will contain a lot of unnecessary information. For example, I use Andrews' pitchfork, fibo levels, Pesavento patterns, channels. Sometimes I create wave counting. I don't use Gartley pattern search. Write what interests you.
=============
In a simplified form, to enable the search for Gartley patterns on the graphical interface panel, press the Insert - ZZ- 11 buttons. For better understanding -
you can read articles https://www.mql5.com/en/articles/2966 https://www.mql5.com/en/articles/2990
But after the release of the second article, there were some changes in the interface. Instead of the Select button, the Default button and the "Choice and creation of 5 dot patterns" button appeared And you can read about it in Russian https://www.mql5.com/ru/articles/6363 Also, more than 10 years ago, two articles were published for working with ZUP without a graphical interface.
https://www.mql5.com/en/articles/1468
https://www.mql5.com/en/articles/1470
faithdefender
1736
faithdefender 2021.01.09 20:56 
 

Kullanıcı incelemeye herhangi bir yorum bırakmadı

Andrey Belchenko
63
Andrey Belchenko 2020.06.04 15:34 
 

Отличный индикатор, Евгений. Было бы здорово еще на него поставить Алерт (Push-сообщение, чтобы получать на смартфон) при торговле "ExtIndicator = 11: search Patterns", с установками по тайм-фреймам)

Eugeni Neumoin
6531
Geliştiriciden yanıt Eugeni Neumoin 2021.04.28 20:21
Это давно сделано.
Fawkes7k
84
Fawkes7k 2020.05.28 12:31 
 

Один из редчайших индикаторов который действительно стоит своих денег, а цена сильно занижена. Видна колоссальная и многолетняя работа по разработке улучшению оптимизации и поддержке данного индикатора. Автору огромный респект, он явно мастер своего дела.

Profit_Trader
88
Profit_Trader 2020.03.13 20:04 
 

The system in complicated but it works! Thank you!

Heiner G.
530
Heiner G. 2020.02.14 19:56 
 

Kullanıcı incelemeye herhangi bir yorum bırakmadı

Jebs siptungkha
966
Jebs siptungkha 2019.08.22 12:44 
 

Kullanıcı incelemeye herhangi bir yorum bırakmadı

Christoph Michael Hoelzel
128
Christoph Michael Hoelzel 2019.05.02 17:29 
 

Kullanıcı incelemeye herhangi bir yorum bırakmadı

Peter
1093
Peter 2019.04.18 07:49 
 

Still learning about this excellent tool and great support.

[Silindi] 2019.04.16 11:54 
 

Kullanıcı incelemeye herhangi bir yorum bırakmadı

Barour Bilal
2433
Barour Bilal 2019.04.08 14:16 
 

Kullanıcı incelemeye herhangi bir yorum bırakmadı

Aravind Kolanupaka
9050
Aravind Kolanupaka 2019.04.08 12:36 
 

Kullanıcı incelemeye herhangi bir yorum bırakmadı

xusim
34
xusim 2019.01.01 11:55 
 

Excellent !!!

Shaheen Hassanali
6686
Shaheen Hassanali 2018.12.02 15:35 
 

Kullanıcı incelemeye herhangi bir yorum bırakmadı

[Silindi] 2018.11.25 21:13 
 

Kullanıcı incelemeye herhangi bir yorum bırakmadı

[Silindi] 2018.11.18 20:55 
 

Kullanıcı incelemeye herhangi bir yorum bırakmadı

TipMyPip
2643
TipMyPip 2018.09.15 17:04 
 

Kullanıcı incelemeye herhangi bir yorum bırakmadı

12
İncelemeye yanıt
Sürüm 154.224 2024.09.24
Подкорректировал вывод экранных форм
Sürüm 154.223 2024.09.19
Для зигзагов в режиме DT добавлено значение параметра ExtLabel=3
Sürüm 154.222 2024.09.12
Внесены изменения для совместимости с другими программами.
Sürüm 154.21 2024.05.12
Исправлено масштабирование графических объектов для разных мониторов.
Sürüm 154.20 2024.02.19
Исправлен вывод small menu при редактировании параметров вил Эндрюса
Sürüm 154.19 2024.02.16
Исправлен вывод small menu при задании параметров вил Эндрюса.
Sürüm 154.18 2023.07.22
В некоторых случаях при создании графического объекта через графический интерфейс объект не создается.
Во вкладке Эксперты в данном случае будет выводиться сообщение: "Unable to create object. Choose another anchor point." - Невозможно создать объект. Выберите другую точку привязки.
Sürüm 154.17 2023.07.21
Исправлена ошибка, связанная с пропуском котировок.
Sürüm 154.16 2023.07.21
Исправил вывод цвета линий UWL и LWL в вилах Эндрюса.
Sürüm 154.15 2023.06.29
Исправлен вывод графических объектов при ExtIndicator = 15
Sürüm 154.14 2023.06.29
Исправлен вывод графических объектов при ExtIndicator = 15
Sürüm 154.13 2023.02.03
Исправил в мониторе паттернов цвет надписей с названиями паттернов. Цвет надписей стал соответствовать цвету паттернов на графике.
Sürüm 154.12 2022.11.23
Исправлена "работа" параметров ExtFractal и ExtFractalEnd.
Сделал по умолчанию вывод следующих графических объектов:
паттерны Песавенто, поиск паттернов Gartley, динамических и статических уровней Фибоначчи, динамических и статических комплектов вил Эндрюса.
Для отключения перечисленных графических инструментов необходимо устновить параметры со следующими значениями:
ExtHidden=0
ExtIndicator=0
ExtFiboDynamic=false
ExtFiboStatic=false
ExtPitchforkDynamic=0
ExtPitchforkStatic=0
Sürüm 154.11 2022.11.23
Исправлена "работа" параметров ExtFractal и ExtFractalEnd.
Сделал по умолчанию вывод следующих графических объектов:
паттерны Песавенто, поиск паттернов Gartley, динамических и статических уровней Фибоначчи, динамических и статических комплектов вил Эндрюса.
Для отключения перечисленных графических инструментов необходимо устновить параметры со следующими значениями:
ExtHidden=0
ExtIndicator=0
ExtFiboDynamic=false
ExtFiboStatic=false
ExtPitchforkDynamic=0
ExtPitchforkStatic=0
Sürüm 154.10 2022.11.23
Исправлена "работа" параметров ExtFractal и ExtFractalEnd.
Сделал по умолчанию вывод следующих графических объектов:
паттерны Песавенто, поиск паттернов Gartley, динамических и статических уровней Фибоначчи, динамических и статических комплектов вил Эндрюса.
Для отключения перечисленных графических инструментов необходимо устновить параметры со следующими значениями:
ExtHidden=0
ExtIndicator=0
ExtFiboDynamic=false
ExtFiboStatic=false
ExtPitchforkDynamic=0
ExtPitchforkStatic=0
Sürüm 154.9 2022.11.11
Удален код преобразования базы данных из первых верси ZUP с графическим интерфейсом в более поздние версии. Как устаревший.
Испрравлено выделение символов волновой разметки на графике для перемещения символа или удаления символа. При нажатии клавиши CTRL и левой кнопки мыши на символе волны.
Исправлена работа с комбинацией клавиш SHIFT-S.
Sürüm 154.7 2022.05.29
В данной версии корректируются параметры линий реакции динамических и статических вил Эндрюса, которые были неверно преобразованы после версии 154.3
Sürüm 154.6 2022.05.28
Исправлена ошибка преобразования значения линий реакции динамических вил Эндрюса при переходе с версии 154.3 на последующие версии.
Sürüm 154.5 2022.05.07
Исправлена ошибка расчета красной зоны в вилах Эндрюса.
Sürüm 154.4 2022.02.06
Исправлены ошибки.
Sürüm 154.3 2021.07.07
Сделаны небольшие изменения, улучшающие работу программы.
Sürüm 154.2 2021.06.11
Проведена небольшая оптимизация. Исправлены ошибки.
Sürüm 154.1 2021.06.10
Исправлены ошибки.
Sürüm 154.0 2021.06.08
Изменен формат хранения графических объектов в файлах в папке //MQL4/Files/ZUP/Objects/
Это сделано для привязки цвета объектов к цвету волнового уровня, если объект был создан с привязкой к вершинам какого-либо волнового уровня. Но если в дальнейшем цвет объекта будет изменен вручную, то произойдет отвязка цвета объекта от волнового уровня.

Также изменена структура хранения параметров в файлах.

В пункты меню Default графических инструментов добавлена возможность корректировки параметров зигзага ExtIndicator=0.

Добавлен параметр FiboFan для включения вывода произвольных фибо вееров. Ранее включение данного графического инструмента осуществлялось изменением цвета.
Аналогичные параметры добавлены для Versum level - VLStatic и VLDynamic.

Появилась возможность вывода на один график до 10 экземпляров ZUP. При этом все 10 индикаторов можно настраивать с помощью графического интерфейса.
Каким образом это делается.
Важно - все экземпляры ZUP должны иметь уникальные номера параметра ExtSet. Этот параметр для удобства настройки переведен в начало списка параметров индикатора. При выводе второго и последующих экземпляров индикатора необходимо задать уникальное значение данного параметра.
Первому экземпляру будет присвоен номер панели графического интерфейса 0.
Второму и последующим экземплярам от 1 до 9. Но не рекомендуется устанавливать большое количество эземпляров. Это повышает нагрузку на процессор компьютера. Лучше обходиться одним экземпляром.

Каким образом производится переключение графических панелей между экземлярами.
Это производится с помощью комбинации клавиш SHIFT - 0, SHIFT - 1 и так далее вторая клавиша соответствует номеру графической панели.

Как узнать, какой экземпляр индикатора подключен к графической панели.
В левом верхнем углу окна с графиком на графической панели выведена кнопка в виде восклицательного знака.
При наведении курсору мыши на данную кнопку во всплывающей подсказке номер окна с графиком, номер графической панели и значение параметра ExtSet.
Номер окна с графиком заносится в названия файлов, которые ZUP создает в данном окне с графиком.

Также эти три параметра выводятся в меню Common в конце списка. То есть внизу четвертой колонки параметров данного меню.

Исправлены замеченные ошибки. Например, ошибка возникавшие при создании волновой разметки. И другие.
Sürüm 153.60 2021.02.13
Добавлена возможность включения/выключения <small menu> с помощью сочетания клавиш SHIFT-S.
Внесены изменения при выборе канала ExtTypeChannals=3
Sürüm 153.59 2020.08.08
Немного доработан алгоритм вывода канала при ExtTypeChannels=3
Sürüm 153.58 2020.07.16
Для стандартного зигзага (ExtIndicator=0) в меню Default равноудаленных каналов добавлена возможность редактирования параметров зигзага также как в меню Default вил Эндрюса. Это позволяет быстро выявить структуру движений рынка.
Sürüm 153.57 2020.07.15
Исправлена работа каналов в динамическом режиме.
Sürüm 153.56 2020.07.09
Исправлена ошибка.
Sürüm 153.55 2020.07.07
Исправлена ошибка.
Sürüm 153.53 2020.07.04
Добавлены еще два вида каналов.
При ExtTypeChannels=3 формируется такой же канал как и при ExtTypeChannels=2, но на трех лучах зигзага.
При ExtTypeChannels=4 можно выводить на первых 10 лучах зигзага такой же канал, как при создании канала путем привязки к экстремумам зигзага или к волновой разметке с помощью графического интерфейса. Но без жесткой привязки.

Исправлены ошибки.
Sürüm 153.52 2020.07.04
Добавлены еще два вида каналов.
При ExtTypeChannels=3 формируется такое же канал, но на трех лучах зигзага.
При ExtTypeChannels=4 можно выводить на первых 10 лучах зигзага такой же канал, как при создании канала путем привязки к экстремумам зигзага или к волновой разметке с помощью графического интерфейса. Но без жесткой привязки.
Sürüm 153.51 2020.06.25
Исправил равноудаленные каналы.
Sürüm 153.49 2020.05.26
Исправлен алгоритм расширенного режима.
Sürüm 153.48 2020.05.14
Исправлен вывод каналов. Два вида каналов были включены в ZUP примерно в 2007 году. Трендовый канал ранее выводился на график иногда с ошибками.
Доработан алгоритм расширенного режима для графических инструментов, привязываемых к двум точкам.
Sürüm 153.47 2020.04.27
Исправил задание расчета зигзага через графический интерфейс при значении ExtMaxBar=0.
При данном значении зигзаг рассчитывается на всей доступной истории.
Sürüm 153.46 2020.04.12
Исправил вывод статических вил при значении ExtPitchforkStatic=3
Sürüm 153.45 2020.04.04
Исправил вывод ценовых меток в вилах Эндрюса, созданных с помощью графического интерфейса.
Sürüm 153.44 2020.04.04
Исправил вывод ценовых меток в вилах Эндрюса, созданных с помощью графического интерфейса.
Sürüm 153.43 2020.02.11
В маленькое меню Default корректировки параметров вил Эндрюса в режиме поиска паттернов (ExtIndicator=11 и AlgorithmSearchPatterns=0) добавлены параметры настройки зигзагов: ParametresZZforDMLEWA, minBars и ExtBackstep.
Sürüm 153.42 2020.02.11
В маленькое меню Default корректировки параметров вил Эндрюса в режиме поиска паттернов (ExtIndicator=11) добавлены параметры настройки зигзагов: ParametresZZforDMLEWA, minBars и ExtBackstep.
Sürüm 153.41 2019.08.26
Исправил вывод паттернов
Sürüm 153.40 2019.08.22
Изменил вывод паттернов Gartley
Sürüm 153.39 2019.08.22
Добавлена в меню Common всплывающая подсказка с номером фибо уровня в поле редактирования параметра ExtFiboTypeFree
Sürüm 153.38 2019.08.21
Восстановил рамку потенциальной разворотной зоны паттернов Gartley
Sürüm 153.37 2019.08.21
Исправлена прорисовка паттернов Gartley
Sürüm 153.36 2019.08.20
Исправлено вывод фибо уровней.
Добавлено значение параметра ParametresZZforDMLEWA=9
Sürüm 153.35 2019.08.19
Исправлена в меню Common корректировка параметра ExtFiboTypeFree
Sürüm 153.34 2019.08.14
Исправлен вывод динамических патттернов Песавенто.
Sürüm 153.33 2019.08.01
Внесены небольшие исправления
Sürüm 153.32 2019.07.22
Внесены небольшие исправления.
Sürüm 153.30 2019.07.06
Если значение параметра Save Parameters в меню Common равно 0 или 1, изменение любых параметров вызывает изменение соответствующих параметров ZUP на всех связанных графиках.
Sürüm 153.29 2019.07.06
Исправил логику работы с параметром Save Parameters в меню Common.
Sürüm 153.28 2019.06.18
Исправлен вывод на график паттернов Песавенто.
Sürüm 153.27 2019.06.13
Оптимизировал вывод на график паттернов Песавенто.
Sürüm 153.26 2019.06.13
Исправлен вывод паттернов Песавенто.
Sürüm 153.25 2019.06.12
Внесены исправления по замечаниям пользователей.
Sürüm 153.24 2019.06.10
Исправил работу редактора паттернов.
Sürüm 153.23 2019.06.10
В меню Common графического интерфейса добавлены кнопки для редактирования параметров изменения стиля вывода зигзагов: ExtStyleZZ, ExtColorZigzag, ExtWidthZigzag, ExtStyleZigzag.
Откорректирован инамический вывод паттернов Песавенто.
Sürüm 153.22 2019.06.07
Сделаны небольшие исправления.
Sürüm 153.21 2019.06.01
Откорректировал редактирование параметра GrossPeriod в маленьком меню Default для вил Эндрюса.
Sürüm 153.20 2019.05.31
Откорректирована работа динамических графических инструментов.
Исправлена работа ZUP при отключенном графическом интерфейсе.
Sürüm 153.19 2019.05.23
Исправлены ошибки
Sürüm 153.18 2019.05.15
Исправлена логика работы параметра maxBarToD
Sürüm 153.17 2019.05.14
Исправил вывод на график графического инструмента Versum level
Sürüm 153.16 2019.05.08
Исправил логику работы программы с параметром ExtIndicator
Sürüm 153.15 2019.05.05
Исправлена ошибка.
Sürüm 153.14 2019.05.05
Исправлены граничные значения параметров.
Sürüm 153.13 2019.05.04
Исправлены ошибки.
Sürüm 153.12 2019.04.27
Добавил всплывающие подсказки для зависимых кнопок редактирования параметров.
Например, с помощью кнопки minBars для ExtIndicator=0 можно редактировать параметр minBars только когда параметр ParametresZZforDMLEWA=0.
При наведении на число в кнопке minBars во всплывающей подсказке выводится значение параметра ParametresZZforDMLEWA, при котором можно редактировать параметр minBars.

Некоторые зависимые параметры могут выводиться в меню Default только после того, как параметр от которого они зависят примет допустимое значение.
Sürüm 153.11 2019.04.23
Сделаны небольшие исправления.
Sürüm 153.10 2019.04.18
Исправил работу с поверхностью создания паттернов.
Sürüm 153.9 2019.04.16
Сделаны небольшие изменения при работе с поверхностью создания паттернов.
Sürüm 153.8 2019.04.15
Добавлен вывод монитора паттернов совместно с панелями графического интерфейса.
Включается в меню Default для паттернов Gartley кнопкой MonitorPatterns. По умолчанию включен.

Добавлены всплывающие подсказки к некоторым кнопкам меню.
У кнопки ZZ во всплывающей подсказке выводится текущее значение ExtIndicator.
У кнопки ! в левом верхнем углу во всплывающей подсказке выводится номер окна с графиком. Например номер 123456789.
Программа сложная. Не искючаю, что может возникнуть аварийное завершение при каких-то значениях параметров, установленных с помощью графического интерфейса. Можно попробовать переключить таймфрейм для восстановления работы. Если это не поможет, то необходимо удалить один или два файла.

Для этого открыть каталог с данными. Зайти в папку MQL\Files\ZUP. В этой папке удалить файл spR_123456789.bin. Если он там будет находиться. Этого файла может и не быть.
В папке MQL\Files\ZUP\SaveParametrs удалить файл pE123456789.bin с параметрами для ZUP, установленного в этом окне. Номер окна может быть любым. Здесь взят условный номер для примера. Этот номер буде при значении кнопки Save Parameters = 2 в меню Common.

Создано маленькое меню Default для оперативной настройки вил Эндрюса. Включается кнопкой small menu.
В этом меню находятся самые необходимые кнопки с параметрами для быстрой настройки вил Эндрюса и кнопки настройки зигзагов для быстрого нахождения экстремумов, к которым вилы привязываются.


Исправлены замеченные ошибки.
Sürüm 153.7 2019.04.09
Восстановил работу выбора параметра в окне создания паттернов с помощью графического интерфейса.
В 153 версии данное окно подключается кнопкой "Choice and creation of 5 dot patterns".
Ранее эта кнопка называлась "Select".
Sürüm 153.6 2019.04.09
Изменил вывод паттернов Песавненто.
Sürüm 153.5 2019.04.09
Внесено небольшое изменение при вызове меню Default.

------------------------------------------------------------------------
Существенное изменение в 153 версии ZUP.

При подключенном графическом интерфейсе (ExtPanel=true) на работу ZUP влияют параметры, задаваемые через графический интерфейс. Графический интерфейс подключен по умолчанию. Поэтому, например, на поиск паттернов при подключенном графическом интерфейсе не влияют параметры, заданные через окно изменения параметров. Для поиска паттернов необходимо нажать кнопку ZZ и потом выбрать кнопку 11. При нажатии на кнопку 11 подключается режим ExtIndicator=11 - режим поиска паттернов. И в меню, выводимом у кнопки 11 настраиваются параметры поиска паттернов. Кнопки с номерами соответствуют режимам ExtIndicator. И меню подключаемые этими кнопками будут настраивать соответствующие зигзаги.
А с помощью меню Default настраиваются параметры графических инструментов.
В меню Common настраиваются все остальные параметры.
Есть параметры, которые настраиваются только через окно настройки параметров.
Перечислю их.
Для поиска паттернов:
CustomPattern
NameCustomPattern
minXB
maxXB
minAC
maxAC
minBD
maxBD
minXD
maxXD

Для вил Эндрюса:
ExtCustomStaticAP
AutoMagnet
AMBars
ExtPitchforkCandle
ExtDateTimePitchfork_1
ExtDateTimePitchfork_2
ExtDateTimePitchfork_3
ExtPitchfork_1_HighLow

Другие параметры:
chHL_PeakDet_or_vts
NumberOfBars
NumberOfVTS
NumberOfVTS1

ExtObjectColor
ExtObjectStyle
ExtObjectWidth


ZigZagHighLow

ExtSave
info_comment
infoTF

ExtVisible
ExtReset
ExtPanel
ExtSet


Если отключить (ExtPanel=false) графический интерфейс, то настраивать параметры можно, как и раньше, через окно настройки параметров.
Sürüm 153.4 2019.04.08
Добавлено удаление объектов меню с графика
Sürüm 153.3 2019.04.07
Сделал контроль ввода допустимых значений в параметр ExtPitchforkStaticNum.
Исправил замеченные ошибки.
Sürüm 153.2 2019.04.05
Добавил кнопку SelectPattern в меню редактирования параметров паттернов Gartley.
Исправил удаление символов волновой разметки на графике.
Sürüm 153.1 2019.04.03
Большинство параметров стало возможно настраивать через графический интерфейс.
Для настройки параметра ExtIndicator добавлена кнопка ZZ. Параметры каждого зигзага стало возможно настраивать индивидуально. Настройка осуществляется мгновенно.
Для настройки параметров графических инструментов добавлена кнопка Default. Для настройки спиралей эта кнопка называется D.
Все остальные параметры настраиваются через кнопку Common.
Небольшое количество параметров не настраивается через графический интерфейс.
Это параметры, которые потеряли актуальность после создания графического интерфейса, параметры, которые не соответствуют идеологии ZUP (VTS), параметры, которые при настройке через графический интерфейс могут создать тупиковую ситуацию (ExtSet, ExtPanel...).


Добавлены в графический интерфейс несколько новых параметров для удобства.
Например, в группе Common, параметр Save Parameters позволяет сохранять настройки, то есть все параметры.
Save Parameters = 0 - при такой настройке параметры может использовать любой экземпляр ZUP терминала.
Save Parameters = 1 - при такой настройке параметры используются для настройки отпереленного финансового инструмента, например, валютной пары EURUSD.
Save Parameters = 2 - настройка по умолчанию. Параметры сохраняются только для текущего окна с графиком финансового инструмента.

Важно!
При нажатии на выше приведенные кнопочки выпадает меню со списками параметров. Меню имеют определенный размер по вертикали. Чтобы все строки меню умещались на экране, необходимо чтобы монитор по вертикали имел настройку не менее 800 точек.

Настройка параметров производится с помощью кнопок.
С помощью стрелок около кнопок можно перебирать значения параметра из допустимого диапазона или из списка и редактировать - изменять значение параметра. Но, например, при настройке списков фибо уровней или списков наборов цветов стрелками выбирается значение из списка. Но редактировать выбранное значение можно при нажатии на кнопку со значением фибо уровня или после нажатия на кнопку с цветом.
Все кнопки, на которых выводится какое-либо числовое значение можно редактировать как с помощью стрелок, так и при нажатии на кнопку.
Кнопки параметров со списком "битов" - выводится список 1 и 0 - редактируются при нажатии на 1 или на 0. После этого изменяется соответствующее значение на 0 или на 1. При подведении курсора мыши к значению бита во всплывающей подсказке выводится, на что влияет значение этого бита.

Для удобства некоторые меню разбиваются на несколько страниц. Количество страниц зависит от разрешения монитора по горизонтали. С помощью кнопки Page выбирается страница. Также можно выбрать отдельную колонку меню с помощью кнопки Column. Это сделано для того, чтобы окно с меню не перекрывало график.

Sürüm 152.21 2019.01.22
Исправил работу с цветом при выводе вил Эндрюса.
Sürüm 152.20 2018.12.03
Добавлена возможность изменения порядка расположения кнопок на меню выбора графических инструментов.
Для изменения порядка расположения кнопок необходимо нажать на кнопку Insert. Нажимаем на кнопку одного из 12 графических инструментов. Нажимаем на клавиши SHIFT и стрелка вправо на чистовой клавиатуре для перемещения кнопки вправо. Или нажимаем SHIFT и стрелка влево для перемещения кнопки влево. Одно нажатие на стрелку вызывает одно перемещение позиции кнопки.

Sürüm 152.19 2018.11.25
Добавлено.
Если на меню выбора графических инструментов задана работа с фибо проекциями, то при нажатии на графике на линию фибо уровня в графическом инструменте фибо проекции, созданного с помощью графического интерфейса ZUP, на дополнительном меню для фибо проекций будет выведено значение фибо уровня для этой линии.
Sürüm 152.18 2018.11.25
Добавлено.
Если на меню выбора графических инструментов задана работа с фибо каналами, то при нажатии на графике на линию фибо уровня в графическом инструменте фибо каналы, созданного с помощью графического интерфейса ZUP, на дополнительном меню для фибо каналов будет выведено значение фибо уровня для этой линии.
Sürüm 152.17 2018.11.06
Отрегулировал работу кнопок Hide и Del на графическом интерфейсе.
Если надпись на кнопке черного цвета, то кнопка работает.
Если серого цвета, то кнопка не работает.
Sürüm 152.16 2018.11.04
Отрегулировал работу кнопок "Target Line" для канала Фибоначчи и равноудаленного канала и кнопки "Target" для вил Эндрюса в графическом интерфейсе. Надписи на данных кнопках стали выводиться черным или серым цветом. Серым цветом надпись выводится в том случае, когда не имеет смысла или не предусматривается работа кнопок.
Sürüm 152.15 2018.10.30
Добавлено.
Если на меню выбора графических инструментов задана работа с фибо уровнями, то при нажатии на графике на линию фибо уровня, созданного с помощью графического интерфейса ZUP, на дополнительном меню для фибо уровней будет выведено значение фибо уровня для этой линии.
Sürüm 152.14 2018.10.24
Добавлены всплывающие подсказки к линиям Шиффа в комплекте вил Эндрюса.
Sürüm 152.13 2018.09.14
Добавлены возможность корректировки волновой разметки с помощью графического интерфейса.
После нанесения на график символов волновой разметки необходимо подвести курсор мыши к символу волновой разметки. Далее нажать комбинацию клавиша CTRL и левая кнопка мыши. Появится меню.
Стрелками можно изменить волновой уровень волны, к которой относится выбранный символ. Или волновой уровень волны и всех волн, входящих в структуру выбранной волны.
Также можно удалить. Для удаления внизу меню расположено 5 кнопок.
S - удаление выбранного символа.
W - удаление волны, в состав которой входит выбранный символ.
St - удаление волны, в состав которой входит выбранный символ, и всех волн входящих в структуру этой волны. Удаление структуры.
L - удаление всех символов волнового уровня, к которому относится выбранный символ.
M - удаление всей разметки.
Перед удалением появляется предупреждающее окно. В данном окне необходимо подтвердить согласие или не согласие с предложенными действиями.
При наведении на любой пункт меню курсора мыши появляются всплывающие подсказки.

Добавлено множество небольших исправлений в графическом интерфейсе.
Sürüm 152.12 2018.07.30
Добавлены всплывающие подсказки для линий VectorOfAMirrorTrend и для рамки PointD при выводе паттернов.
Sürüm 152.11 2018.07.26
Исправлена логика работы параметра ExtSet
Sürüm 152.10 2018.07.24
Added tooltips for Equilibrium, Reaction1 and Reaction2 lines when displaying five-dot Gartley patterns.
Fixed errors occurring in case of big ExtMaxBar values.
Sürüm 152.9 2018.05.14
Fixed the display of price labels in the Andrews' Pitchfork.
Sürüm 152.8 2018.03.08
Added a tooltip when hovering the mouse cursor over PivotZZ line
Sürüm 152.7 2018.01.23
Fixed bugs.
Sürüm 152.6 2017.12.14
Fixed display of target labels in Andrews' Forks created using the graphics interface.
Sürüm 152.5 2017.10.23
Fixed the button that shows/hides the Fibonacci projection graphics tool in Fibonacci projections editing menu.
Sürüm 152.4 2017.10.11
Fixed an error in processing of extremums.
Sürüm 152.3 2017.09.12
Fixed the error with the output of wave character highlight when applying the wave layout to the chart.
Sürüm 152.2 2017.07.13
Added the ability to create new five-point patterns by editing parameters of one of the 33 patterns built into the indicator. When editing is complete, it is suggested to save the new pattern to an external CSV file.

Fixed the logic of connection to pattern search using the graphical interface.

Fixed known bugs.
Sürüm 152.1 2017.06.27
Added graphical interface controls for patter search.
Using the GUI, it is now possible to:
1. enable or disable search for different patterns;
2. create new patterns;
3. edit pattern parameters;
4. save newly created patterns to a file;
5. enable search for patterns from the selected file;
6. create lists of patterns for search.
Sürüm 151.9 2017.03.20
Changed the algorithm of binding the wave symbols to extremums of the price bars.
Sürüm 151.8 2017.03.14
Made changes to the pattern search algorithm
Sürüm 151.7 2017.03.09
Fixed the pattern search algorithm
Sürüm 151.6 2017.02.13
Fixed the algorithm for fractal filtering of the wave layout.
Earlier, the fractal filtering hid the wave layout, when certain timeframes were missing quotes.
Sürüm 151.5 2017.02.09
Fixed saving of the number of the wave layout attached to the chart.
Added a monthly check for presence of files with object archives for the deleted windows with charts.
In case such files are found, they are deleted.

Fixed names of the colors in the color selection table.
Sürüm 151.4 2017.01.31
Fixed the deletion of one wave level of the wave layout.
There was the following error. If one wave level was created, and then only this level was deleted, the ZigZag was removed but the symbols of the wave level remained on the chart until the indicator was reloaded or timeframe was changed.
Sürüm 151.3 2017.01.09
Added. When hovering over the pattern lines created using parameters, the tooltip displays the range of timeframes where the tooltips can be displayed without distortions.
Also, when hovering the pattern name in the pattern monitor, the tooltip displays a similar range of timeframes.
Fixed known bugs.