RenkoChannelSignals
- Göstergeler
- Sergey Deev
- Sürüm: 1.1
- Güncellendi: 18 Kasım 2021
- Etkinleştirmeler: 5
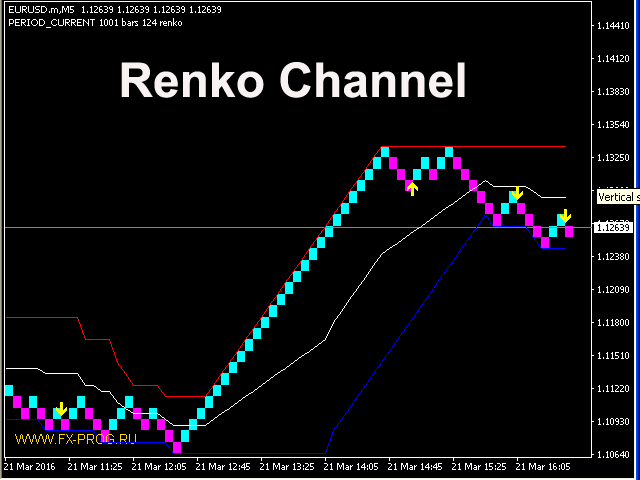
The indicator displays Renko bars on the chart, plots a channel based on that data and generates buy/sell signals.
Renko is a non-trivial price display method, in which a bar within a time interval is shown on the chart only if the price has moved a certain number of points. Renko bars do not depend on a time interval, therefore the indicator works on any timeframe without losing its efficiency.
The channel is defined as the upper and lower boundaries of the price movement over the specified period. It is displayed on the chart as lines of the specified color and the middle line.
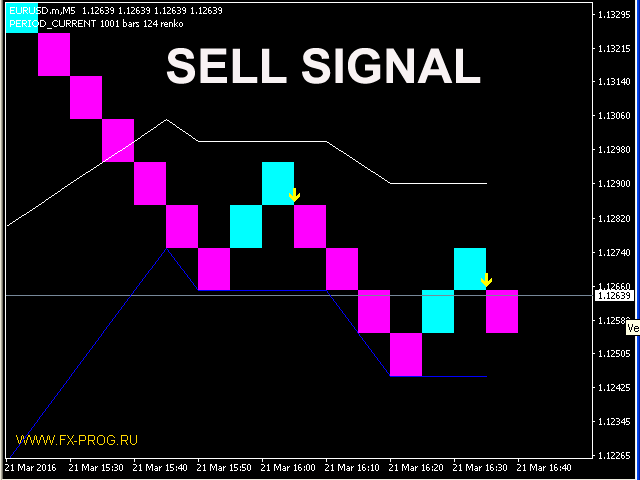
The buy signal is generated when one or multiple Renko bars break through the upper boundary of the channel, followed by the price rolling back up to the middle line with a new bar forming towards the breakout direction. The sell signal is in the opposite direction: the lower boundary is broken through, rollback below the middle line, continued downwards.
The signals are displayed on the chart as arrows of the corresponding direction, by messages in a pop-up window, e-mails and push-notifications. The indicator also generates the EventChartCustom custom event for using the signal in automation of trading. The event generated by the indicator can be handled by an EA in the OnChartEvent function. The indicator passes the following parameters to the event handler: id - identifier; lparam - distance from the middle line of the channel to the maximum rollback of the price in points; dparam - value of the opposite channel line; sparam - text message.
The indicator can be attached on chart of any symbol with any timeframe.
Parameters
- RenkoBar - size of a Renko bar in points (automatically recalculated for five-digit and three-digit quotes);
- CountBars - the number of Renko bars displayed on the chart;
- bearColor - color of a bearish Renko bar;
- bullColor - color of a bullish Renko bar;
- hideBars - flag to hide the usual bars on the chart;
- useHistoryM1 - allow using the M1 quotes for the initial rendering of the indicator;
- chPeriod - PriceChannel period;
- UpColor - color of the upper line of the PriceChannel;
- DownColor - color of the lower line of the PriceChannel;
- MiddleColor - color of the middle line of the PriceChannel;
- SignalColor - color of the signal arrows;
- useAlert - enable pop-up alerts;
- useMail - enable email notifications;
- useNotification - enable push notifications;
- CustomEventBuy - identifier of a custom buy event (0 - disabled);
- CustomEventSell - identifier of a custom sell event (0 - disabled);


