RenkoBandMacd
- Göstergeler
- Sergey Deev
- Sürüm: 1.3
- Güncellendi: 18 Kasım 2021
- Etkinleştirmeler: 5
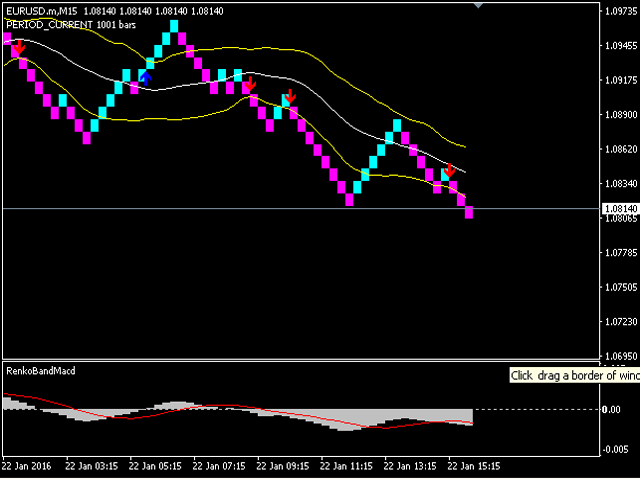
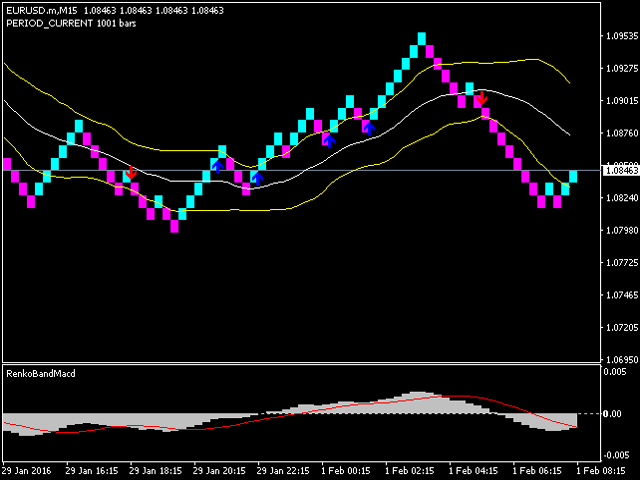
The indicator displays Renko bars on the chart, uses their data to calculate and display the Bollinger Bands, MACD oscillator and generates buy/sell signals.
Renko is a non-trivial price display method, in which a bar within a time interval is shown on the chart only if the price has moved a certain number of points. Renko bars do not depend on a time interval, therefore the indicator works on any timeframe without losing its efficiency. When attached to a chart, the indicator checks for presence of the M1 history data and calculates the Renko bars based on that data. In this case, the indicator will look the same for all the time frames. If the M1 history data is missing, the indicator calculated the Renko bars based on the current time frame.
A buy signal is generated when the next Renko bar crosses the Bollinger Bands upwards, and the MACD signal line is below its histogram.
The signals are displayed on the chart as arrows of the corresponding direction and color, by messages in a pop-up window, e-mails and push-notifications. The indicator also generates the EventChartCustom custom event for using the signal in automation of trading. The event generated by the indicator can be handled by an EA in the OnChartEvent function. The parameters passed to the event handler from the indicator are the following: dparam - the value of the Bollinger Bands median line for setting stop loss; sparam - text message.
The indicator can be attached on chart of any symbol with any timeframe. The video shows the indicator display on different time frames and a test run of the indicator.
Parameters
- RenkoBar - size of a Renko bar in points (automatically recalculated for five-digit quotes);
- CountBars - the number of Renko bars displayed on the chart (if set to 0, double chart width is used);
- bearColor - color of a bearish Renko bar;
- bullColor - color of a bullish Renko bar;
- hideBars - flag to hide the usual bars on the chart;
- BandPeriod, BandDev - corresponding parameters of the Bollinger Bands indicator;
- UpColor, MiddleColor, DownColor - colors of the upper, median and lower lines of the Bollinger Bands indicator;
- MacdFast, MacdSlow, MacdSignal - corresponding parameters of the MACD indicator;
- MacdColor, MacdSignalColor - colors of the histogram and signal line of the MACD;
- BuySignalColor, SellSignalColor - colors of the signal arrows;
- useAlert - enable pop-up alerts;
- useMail - enable email notifications;
- useNotification - enable push notifications;
- CustomEventBuy - identifier of a custom buy event (0 - disabled);
- CustomEventSell - identifier of a custom sell event (0 - disabled);


Kullanıcı incelemeye herhangi bir yorum bırakmadı