Bid Ask Level
- Göstergeler
- Chantal Sala
- Sürüm: 1.1
- Güncellendi: 30 Ağustos 2022
- Etkinleştirmeler: 10
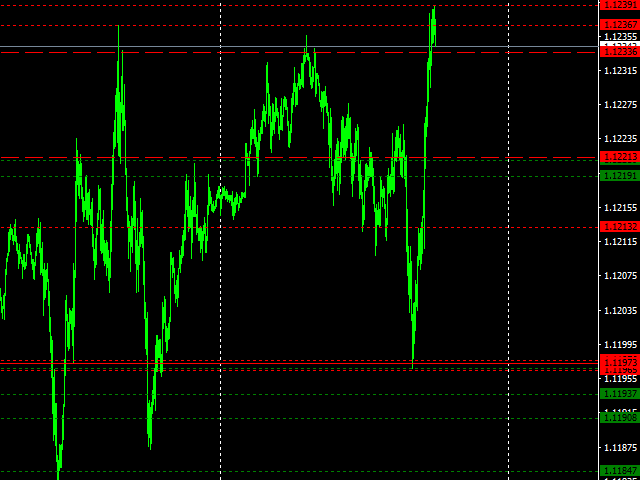
Bid Ask Level is a very simple indicator but, at the same time, very powerful.
Using the logic of the minimum and maximum of the previous periods is able to intercept the important levels of demand and supply.
The indicator permits setting the numbers of history candles to read very important levels in the past and show them in the current chart.
You can see these power levels with horizontal lines designed on the chart.
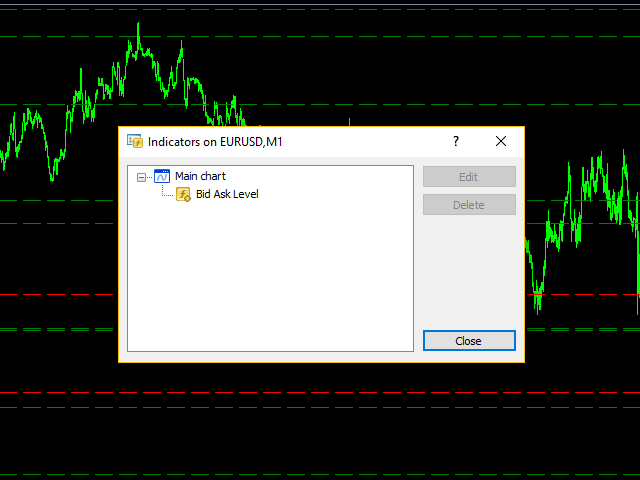
The indicator also permits uploading many different levels (of different timeframes) on the same chart, it is very simple: you can duplicate the indicator on the current chart.
Level Bid Ask is very useful to identify the true levels of support and resistance.
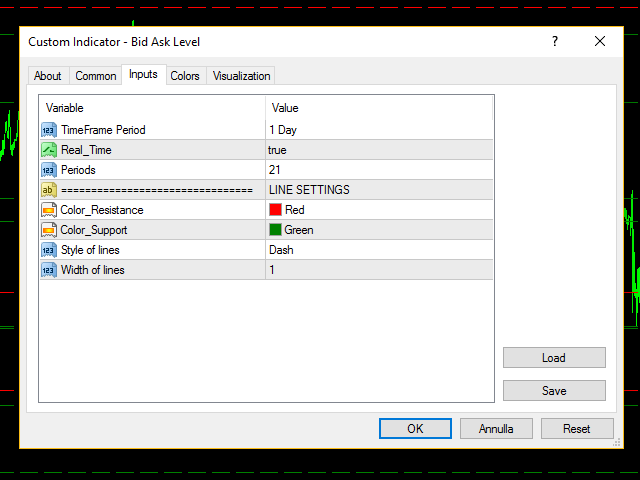
Inputs
- TimeFrame Period = period where the indicator search levels
- Real_Time (true/false) shows the level on the current candle (0) or begin from the last closed candle (1)
- Periods = number of candles
- LINE SETTINGS
- Color_Resistance (lines color)
- Color_Support (lines color)
- Style of lines
- Width of lines

