• Genel bakış
  • İncelemeler (18)
  • Yorumlar (17)
  • Yenilikler

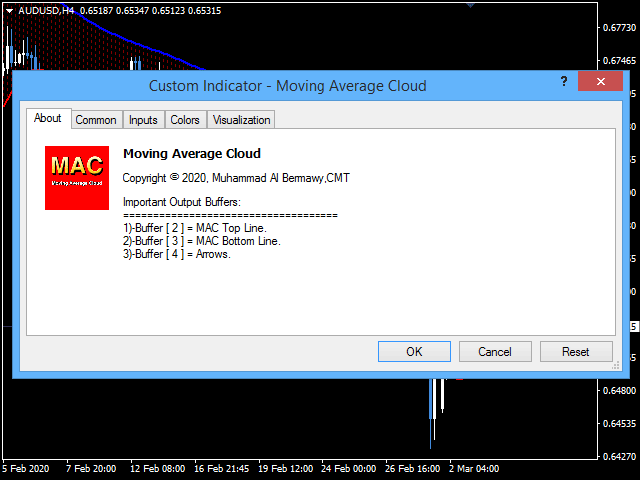
Moving Average Cloud

4.93

Veya "MAC".

Bu, trendi yakalamanıza ve takas etmenize yardımcı olmak için tasarlanmış bir göstergedir. Bu göstergenin arkasındaki fikir, sonraki adımlarda açıklanabilir:

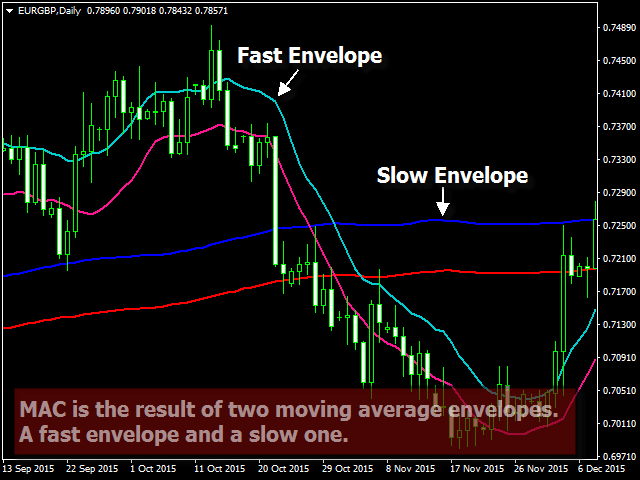
  1. Hızlı hareket eden bir ortalama Zarf çizin.
  2. Yavaş hareket eden bir ortalama Zarf çizin.
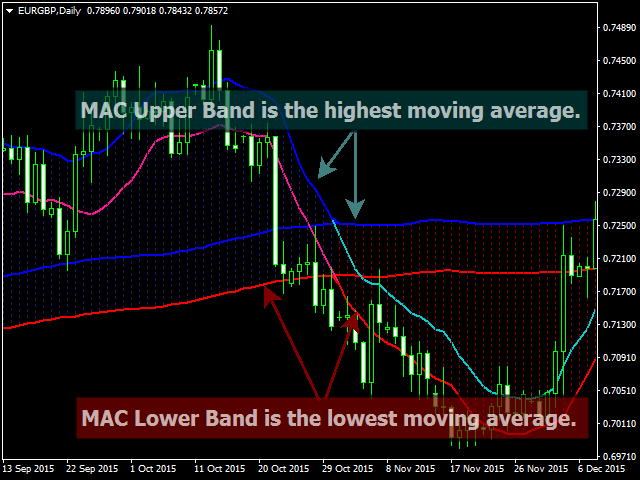
  3. MAC Üst Bandı, her iki Zarfın en yükseği arasındaki en yüksek değerdir.
  4. MAC Alt Bandı, her iki Zarfın alt kısmı arasındaki en düşük değerdir.
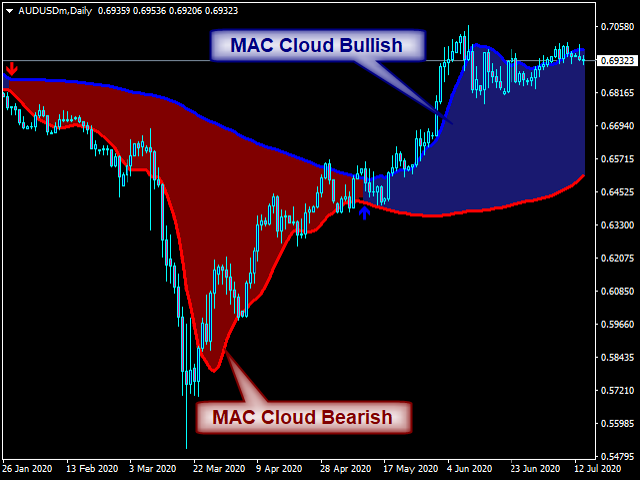
  5. MAC Histogram Bulutu, yön değişikliğinizi göstermek için iki bant arasındaki mesafeyi doldurur.
  6. Mavi Bulut yükseliş trendini, Kırmızı Bulut ise düşüş trendini gösterir.
► Kendi EA veya tarayıcınızı oluşturmak için MAC arabelleklerini nasıl kullanacağınızı görmek için sonraki blogu okuyun:

https://www.mql5.com/en/blogs/post/734293


MAC nasıl kullanılır

  • Trend yönünü belirlemenize yardımcı olması için MAC Bulutlarını bir filtre olarak kullanın.
  • Yalnızca yanlış sinyalleri mümkün olduğunca ortadan kaldırmak için normal ticaret araçlarınızla MAC Bulutları yönünde ticaret yapın.
  • Başlamak için güçlü trend noktaları bulmanıza yardımcı olması için önerilen giriş oklarını kullanın.

MAC Özellikleri

    • MAC, sonuçlarını yeniden boyamaz veya yeniden hesaplamaz.
    • Kripto para birimleri, hisse senedi, endeks, petrol, altın ve tüm zaman dilimlerinde çalışır.
    • Ses, e-posta uyarıları ve Mobil Bildirim.
    • Trend sinyallerini tanımlamaya yardımcı olmak için satın alın, satın oklar.
    • Kullanıcının aralarında kolayca gezinmesine yardımcı olacak iyi tasarlanmış parametreler.
    • Kendi uzman danışmanlarınızı oluşturmak için arabellek.
    • Aralarından seçim yapabileceğiniz dört farklı renk listesi.

    MAC parametreleri

    (1) GÖSTERGE PARAMETRELERİ

    • Hızlı Hareketli Ortalama.Varsayılan 10'dur
    • Yavaş Hareketli Ortalama.Varsayılan 100
    • Hareketli Ortalama Yöntemi.Varsayılan "Basit" Yöntemdir.

    (2) UYARILAR

    • Okları ve Dikey Çizgileri Göster.Varsayılan, yalnızca okları göstermektir.
    • Ok boyutu.Varsayılan birdir.
    • Uyarı mesajı.Uyarı sesini ve mesajını kullanmayı veya durdurmayı seçin (varsayılan değer doğrudur).
    • Eposta gönder.Kullanıcıya e-posta gönderme seçeneği (varsayılan yanlıştır).
    • Mobil Bildirim Gönder.Kullanıcıya mobil bildirim gönderme seçeneği (varsayılan yanlıştır).

    (3) GÖSTERGE TARZI

    • Grafik Renkleri Listesi.Kullanıcı, tablosu için dört farklı renk listesi arasından seçim yapabilir veya kendi listesini kullanmak istiyorsa (Hiçbir Şey Yapma) seçeneğini seçebilir.
    • Boğa Bulut Rengi.Varsayılan Mavi'dir.
    • Bulut Rengi Ayı.Varsayılan Kırmızı'dır.
    • Üst Bulut Kenar Rengi.Varsayılan Gece Mavisi
    • Alt Bulut Kenar Rengi.Varsayılan Bordo'dur.
    • Bulut Kenar Çizgisi Genişliği.Varsayılan birdir.


    Herhangi bir sorunuz varsa lütfen özel mesaj yoluyla bana ulaşın veya yorum bölümüne yazın.
    Muhammed Al Bermaui, CMT


    İncelemeler 18
    davevicens
    321
    davevicens 2023.10.17 16:39 
     

    An execellent indicator. First trade First win!! Good Job

    awasthisp
    764
    awasthisp 2023.08.20 09:53 
     

    This is an execellent indicator. it does give a big help to get more successful trades. Good job

    Hisham Ghoneim
    301
    Hisham Ghoneim 2022.08.18 10:39 
     

    Great work as usual

    Önerilen ürünler
    Signal trend indicator. Detects the direction of the trend and is coloured accordingly.  Has built in audible and visual alerts when trends change. Can send notifications to your phone or email. Allows Trend and Counter-Trend trading. Works on all timeframes, all currency pairs, metals, indices and cryptocurrencies. Can be used with binary options. Distinctive features No re-drawing; Simple and clear settings; Four types of alerts; Works on all timeframes and all trading tools; Su
    HMA Trend Professional MT4
    Pavel Zamoshnikov
    4.57 (7)
    Improved version of the free HMA Trend indicator (for MetaTrader 4) with statistical analysis. HMA Trend is a trend indicator based on the Hull Moving Average (HMA) with two periods. HMA with a slow period identifies the trend, while HMA with a fast period determines the short-term movements and signals in the trend direction. The main differences from the free version: Ability to predict the probability of a trend reversal using analysis of history data. Plotting statistical charts for analyz
    Master Scalping M1 , trendi hızlı ve doğru bir şekilde belirlemek için bir algoritma kullanan yenilikçi bir göstergedir. Gösterge, pozisyonların açılış ve kapanış zamanını hesaplar, gösterge algoritmaları, bir ticarete girmek (bir varlık satın almak veya satmak) için ideal anları bulmanızı sağlar, bu da çoğu tüccar için işlemlerin başarısını artırır. Göstergenin faydaları: Kullanımı kolaydır, çizelgeyi gereksiz bilgilerle aşırı yüklemez. Herhangi bir strateji için bir filtre olarak kullanılabili
    Trend Ray
    Andriy Sydoruk
    The indicator shows the potential trend direction by cyclical-wave dependence. Thus, all the rays of the intersection will be optimal rays, in the direction of which the price is expected to move, taking into account the indicator period. Rays can be used as a direction for potential market movement. But we must not forget that the approach must be comprehensive, the indicator signals require additional information to enter the market.
    Strong Retracement Points Pro demo edition! SRP (Strong Retracement/Reversal Points) is a powerful and unique support and resistance indicator. It displays the closest important levels which we expect the price retracement/reversal! If all level are broken from one side, it recalculates and draws new support and resistance levels, so the levels might be valid for several days depending on the market! If you are still hesitating to start using this wonderful tool, you can check this link to see h
    The indicator allows you to trade binary options. The recommended time frame is М1 and the expiration time is 1,2,3 minutes. The indicator suitable for auto and manual trading. A possible signal is specified as a arrows above/under a candle. You should wait until the candle closes! Arrows are not re-painted Trade sessions: TOKYO section (Half-end) Currency pairs: USD/JPY Working time frame: M1 Expiration time: 1,2,3 minutes. The indicator also shows good results when using the martingale strateg
    FREE
    Noize Absorption Index MT4
    Ekaterina Saltykova
    5 (1)
    Noize Absorption Index - is the manual trading system that measures the difference of pressure between bears forces and bulls forces. Green line - is a noize free index that showing curent situation. Zero value of index shows totally choppy/flat market.Values above zero level shows how powerfull bullish wave is and values below zero measures bearish forces.Up arrow appears on bearish market when it's ready to reverse, dn arrow appears on weak bullish market, as a result of reverse expectation. S
    TWO PAIRS SQUARE HEDGE METER INDICATOR Try this brilliant 2 pairs square indicator It draws a square wave of the relation between your two inputs symbols when square wave indicates -1 then it is very great opportunity to SELL pair1 and BUY Pair2 when square wave indicates +1 then it is very great opportunity to BUY pair1 and SELL Pair2 the inputs are : 2 pairs of symbols         then index value : i use 20 for M30 charts ( you can try other values : 40/50 for M15 , : 30 for M30 , : 10 for H1 ,
    What are Heiken Ashi Candles? Heiken Ashi, derived from the Japanese term 'Heikin Ashi,' translates to average price bars. It's an indicator depicting price bars on a chart. Formula for Heiken Ashi candles: - Heiken Ashi opening price: (previous candle's opening + closing price) / 2 - Closing price Heiken Ashi: (opening + high + low + closing) / 4 - Heiken Ashi peak: Max of high, opening, or closing price - Heiken Ashi bottom price: Min of low, opening, or closing price How to Read Heik
    Trade History Drawer
    David Leander Tschacher
    Trade History Drawer is an indicator for MetaTrader 4. It shows trades on the chart and draws them in customized colors. Furthermore, the indicator shows a trade summary and saves a CSV history file for either one selected pair or all pairs. Inputs General Settings Number Trades : Number of trades to be drawn on the chart, if -1 then all trades Magic Number : Only trades with this magic number, if -1 then ignore Line Style : Line Style Line Thickness : Line Thickness Arrow Size :
    TS krachobor
    Magomed Zakaryaev
    Всем привет! Выставляю свою торговую стратегию для форекс (далее - ТС). После покупки или аренды ТС пишете мне, я вас добавляют в закрытый чат телеграм, где дам все индикаторы и поддержку по торговле, и мы вместе будем торговать. Статистику по торговле в ТС я добавлю чуть позже, так как открыл новый счет по ТС, что бы было наглядно как проходит торговля. Кроме этого  я дам счет и пароль инвестора, можете сами смотреть в живую торговлю и решить для себя подходит ли она для вас. Два режима, 1) Сре
    The principle of this indicator is very simple: detecting the trend with Moving Average, then monitoring the return point of graph by using the crossing of Stochastic Oscillator and finally predicting BUY and SELL signal with arrows, alerts and notifications. The parameters are fixed and automatically calculated on each time frame. Example: If you install indicator on EURUSD, timeframe M5: the indicator will detect the main trend with the Moving Average on this timeframe (for example the Moving
    Blahtech Market Profile
    Blahtech Limited
    4.61 (18)
    Was: $249  Now: $99   Market Profile defines a number of day types that can help the trader to determine market behaviour. A key feature is the Value Area, representing the range of price action where 70% of trading took place. Understanding the Value Area can give traders valuable insight into market direction and establish the higher odds trade. It is an excellent addition to any system you may be using. Blahtech Limited presents their Market Profile indicator for the MetaTrader community. Ins
    Cosmic Diviner X Planet
    Olena Kondratenko
    4 (2)
    This unique multi-currency strategy simultaneously determines the strength of trends and market entry points, visualizing this using histograms on the chart. The indicator is optimally adapted for trading on the timeframes М5, М15, М30, Н1. For the convenience of users, the indicator renders the entry point (in the form of an arrow), recommended take profit levels (TP1, TP2 with text labels) and the recommended Stop Loss level. The take profit levels (TP1, TP2) are automatically calculated for
    Volume by Price MT4
    Brian Collard
    4.71 (14)
    The Volume by Price Indicator for MetaTrader 4 features Volume Profile and Market Profile TPO (Time Price Opportunity). Volume and TPO histogram bar and line charts. Volume Footprint charts. TPO letter and block marker collapsed and split structure charts. Session filtering and grouping. Static, dynamic and flexible range segmentation and compositing methods with relative and absolute visualizations. Graphical layering, positioning and styling options to suit the user's analytic and aesthetic n
    Öncelikle, bu Ticaret Aracının Non-Repainting, Non-Redrawing ve Non-Lagging Gösterge olduğunu vurgulamakta fayda var, bu da onu profesyonel ticaret için ideal hale getiriyor. Çevrimiçi kurs, kullanıcı kılavuzu ve demo. Akıllı Fiyat Hareketi Kavramları Göstergesi, hem yeni hem de deneyimli tüccarlar için çok güçlü bir araçtır. İleri ticaret fikirlerini, Inner Circle Trader Analizi ve Smart Money Concepts Ticaret Stratejileri gibi 20'den fazla kullanışlı göstergeyi bir araya getirerek bir araya g
    RSX Signal 2 AM
    Andriy Matviyevs'kyy
    The indicator displays the signals of the RSX oscillator on the price chart. (To display these signals in a separate window, along with the oscillator, another indicator is used -  RSX Osc 4 AM ). It is optimal to use the indicator signals as signals to open a trade when the price overcomes the maximum or minimum of the bar at which the signal was given. An opposite signal cancels the previous signal. Settings: Data period for indicator calculation - data period for indicator calculation; Data
    FREE
    Gösterge, tarihsel olanlarla karşılaştırılabilecek güncel teklifler oluşturur ve bu temelde bir fiyat hareketi tahmini yapar. Gösterge, istenen tarihe hızlı navigasyon için bir metin alanına sahiptir. Seçenekler: Sembol - göstergenin göstereceği sembolün seçimi; SymbolPeriod - göstergenin veri alacağı dönemin seçimi; GöstergeRenk - gösterge rengi; Ters - doğru tırnakları tersine çevirir, yanlış - orijinal görünüm; Sonraki, tarihi girebileceğiniz ve 'enter' tuşuna basa
    An indicator of pattern #31 ("Long Island") from Encyclopedia of Chart Patterns by Thomas N. Bulkowski. The second gap is in the opposite direction. Parameters: Alerts - show alert when an arrow appears   Push - send a push notification when an arrow appears (requires configuration in the terminal) GapSize - minimum gap size in points ArrowType - a symbol from 1 to 17 ArrowVShift - vertical shift of arrows in points   ShowLevels - show levels ColUp - color of an upward line ColDn - color of
    BE auto
    Muhammad Ridzuan Mohd Radzali
    5 (2)
    Indicator automatically draw bullish and bearish engulfing without any rules. Bearish and Bullish engulf is well known area for supply and demand area marking. This indicator can be used in any strategy that required supply demand zone. Show Last Engulf : Enable this option to show unfresh engulfing  Candle to calculate : set 0 will load all history bar and can use up more memory Bearish Engulfing Colour : Pick any colour that suit Bearish Engulfing Colour  : Pick any colour that suit -Use thi
    FREE
    VR Cub
    Vladimir Pastushak
    VR Cub , yüksek kaliteli giriş noktaları elde etmenin bir göstergesidir. Gösterge, matematiksel hesaplamaları kolaylaştırmak ve bir pozisyona giriş noktalarının aranmasını basitleştirmek için geliştirildi. Göstergenin yazıldığı ticaret stratejisi uzun yıllardan beri etkinliğini kanıtlamaktadır. Ticaret stratejisinin basitliği, acemi yatırımcıların bile başarılı bir şekilde ticaret yapmasına olanak tanıyan büyük avantajıdır. VR Cub, pozisyon açılış noktalarını ve Kâr Al ve Zararı Durdur hedef sev
    TrendPlus
    Sivakumar Subbaiya
    4.21 (14)
    Trend Plus   Trendplus  Indicator   Time Frame: Suitable for any time frame.  Purpose: Trend Prediction. Blue and red candle indicate the buy and sell call respectively. Buy: When the blue candle is formed buy call is initiated. close the buy trades when the next red candle will formed.   Sell: When the Red candle is formed Sell call is initiated. close the Sell trades when the next blue candle will formed.   Happy trade!!
    FREE
    Owl smart levels
    Sergey Ermolov
    4.63 (54)
    MT5 versiyonu  |  FAQ Owl Smart Levels Indicator ,   Bill Williams'ın gelişmiş fraktalları , piyasanın doğru dalga yapısını oluşturan Valable ZigZag ve kesin giriş seviyelerini gösteren   Fibonacci seviyeleri   gibi popüler piyasa analiz araçlarını içeren tek gösterge içinde eksiksiz bir ticaret sistemidir. pazara ve kar elde edilecek yerlere. Stratejinin ayrıntılı açıklaması Gösterge ile çalışma talimatı Baykuş Yardımcısı ticaretinde Danışman Yardımcısı Kullanıcıların özel sohbeti -> Satın ald
    Wave Wolf MT4
    Andrei Salanevich
    Forex Dalga Kurt MT4 göstergesi, Wolf dalgalarını aramak ve mevcut ticaret terminali penceresinde görüntülemek için tasarlanmıştır. Ticarette Wolfe dalgalarını kullanan tüccarlar için mükemmel bir gösterge. Ticaret stratejilerinde kullanımı, verimliliğini ve karlılığını önemli ölçüde artıracaktır. GÖSTERGE BİLGİSİ Diğer Wolf dalga göstergelerinin aksine, forex Wave Wold MT4 göstergesinin etkinliğini önemli ölçüde artıran birçok özelliği vardır: Birincisi, Açık Windows 5Point (true) ayarı bi
    The new update makes this indicator a complete tool for studying, analyzing and operating probabilistic patterns. It includes: On-chart Multi-asset percentage monitor. Configurable martingales. Twenty-one pre-configured patterns , including Mhi patterns and C3. An advanced pattern editor to store up to 5 custom patterns. Backtest mode to test results with loss reports. Trend filter. Hit operational filter. Martingale Cycles option. Various types of strategies and alerts. Confluence between patte
    Kazanma oranı hesaplama sistemi ile donatılmış gösterge [Gösterge Özellikleri] Bu gösterge, işaret sinyalleri aracılığıyla düzenli teknik analizin sezgisel ve kolay bir şekilde onaylanmasını sağlar. Ayrıca, kazanma oranını doğrulayarak mevcut parametrelerin uygunluğunu kontrol edebilir ve kazanma oranı düşük olduğunda sinyal üretmekten kaçınan otomatik bir kazanma oranı belirleme sistemi içerir. Bu, gereksiz girişleri azaltır ve yalnızca yüksek kazanma oranlarının olduğu dönemlerde ticarete o
    This is a new strategy for SUPPLY DEMAND areas It is based on a calculation using the tick volume to detect the big price action in market for both bear /bull actions this smart volume action candles are used to determine the supply and demand areas prices in between main supply and demand lines indicate sideway market  up arrows will be shown when prices moves above the main supply and the secondary supply lines Down arrows will be shown when prices moves below the main demand and the secondary
    ZhiBiCCI MT4
    Qiuyang Zheng
    5 (1)
    [ZhiBiCCI] indicators are suitable for all cycle use, and are also suitable for all market varieties. [ZhiBiCCI] Green solid line is a reversal of bullish divergence. The green dotted line is a classic bullish divergence. [ZhiBiCCI] The solid line to the red is a reverse bearish divergence. The red dotted line is a classical bearish divergence. [ZhiBiCCI] can be set in the parameters (Alert, Send mail, Send notification), set to (true) to send instant signals to the alarm window, email, in
    The indicator displays the data of the Stochastic oscillator from a higher timeframe on the chart. The main and signal lines are displayed in a separate window. The stepped response is not smoothed. The indicator is useful for practicing "manual" forex trading strategies, which use the data from several screens with different timeframes of a single symbol. The indicator uses the settings that are identical to the standard ones, and a drop-down list for selecting the timeframe. Indicator Parame
    Rainbow MT4 is a technical indicator based on Moving average with period 34 and very easy to use. When price crosses above MA and MA changes color to green, it’s a signal to buy. When price crosses below MA and MA changes color to red, it’s a signal to sell. The Expert advisor ( Rainbow EA MT4) based on Rainbow MT4 indicator, as you can see in the short video below is now available here .
    FREE
    Bu ürünün alıcıları ayrıca şunları da satın alıyor
    Gann Made Easy
    Oleg Rodin
    4.93 (87)
    Gann Made Easy , bay teorisini kullanarak ticaretin en iyi ilkelerine dayanan, profesyonel ve kullanımı kolay bir Forex ticaret sistemidir. WD Gann. Gösterge, Zararı Durdur ve Kâr Al Seviyeleri dahil olmak üzere doğru SATIN AL ve SAT sinyalleri sağlar. PUSH bildirimlerini kullanarak hareket halindeyken bile işlem yapabilirsiniz. Lütfen satın aldıktan sonra benimle iletişime geçin! Alım satım ipuçlarımı ve harika bonus göstergelerini ücretsiz olarak sizinle paylaşacağım! Muhtemelen Gann ticaret y
    Scalper Inside PRO
    Alexey Minkov
    4.75 (59)
    An exclusive indicator that utilizes an innovative algorithm to swiftly and accurately determine the market trend. The indicator automatically calculates opening, closing, and profit levels, providing detailed trading statistics. With these features, you can choose the most appropriate trading instrument for the current market conditions. Additionally, you can easily integrate your own arrow indicators into Scalper Inside Pro to quickly evaluate their statistics and profitability. Scalper Inside
    Şu anda %20 İNDİRİMLİ! Herhangi bir Acemi veya Uzman Tüccar için En İyi Çözüm! Bu gösterge paneli yazılımı 28 döviz çifti üzerinde çalışıyor. Ana göstergelerimizden 2'sine (Gelişmiş Para Birimi Gücü 28 ve Gelişmiş Para Birimi Dürtüsü) dayanmaktadır. Tüm Forex piyasasına harika bir genel bakış sağlar. Gelişmiş Para Birimi Gücü değerlerini, para birimi hareket hızını ve tüm (9) zaman dilimlerinde 28 Forex çifti için sinyalleri gösterir. Trendleri ve / veya scalping fırsatlarını belirlemek içi
    TPSpro RFI Levels
    Roman Podpora
    4.86 (21)
    Reversal First Impulse levels (RFI)    INSTRUCTIONS        RUS       -       ENG              R ecommended to use with an indicator   -   TPSpro  TREND PRO -  Version MT5 A key element in trading is zones or levels from which decisions to buy or sell a trading instrument are made. Despite attempts by major players to conceal their presence in the market, they inevitably leave traces. Our task was to learn how to identify these traces and interpret them correctly. Main functions: Displaying activ
    AT Forex Indicator MT4
    Marzena Maria Szmit
    5 (2)
    The AT Forex Indicator MT4 is a sophisticated trading tool designed to provide traders with a comprehensive analysis of multiple currency pairs. This   powerful indicator   simplifies the complex nature of the forex market, making it accessible for both novice and experienced traders. AT Forex Indicator uses   advanced algorithms   to detect trends, patterns and is an essential tool for traders aiming to enhance their forex trading performance. With its robust features, ease of use, and reliabl
    FX Power MT4 NG
    Daniel Stein
    5 (11)
    Sabah Brifingimiz burada mql5 ve on Telegram! FX Power MT4 NG , uzun zamandır çok popüler olan döviz gücü ölçerimiz FX Power'ın yeni neslidir. Peki bu yeni nesil güç ölçer ne sunuyor? Orijinal FX Power hakkında sevdiğiniz her şey PLUS GOLD/XAU güç analizi Daha da hassas hesaplama sonuçları Ayrı ayrı yapılandırılabilir analiz dönemleri Daha da iyi performans için özelleştirilebilir hesaplama limiti Özel çokluDaha fazlasını görmek isteyenler için örnek ayarlar Her grafikte en sevdiğiniz renkler i
    TPSproTREND PrO
    Roman Podpora
    4.78 (18)
    TPSpro TRENDPRO  - is a trend indicator that automatically analyzes the market and provides information about the trend and each of its changes, as well as giving signals for entering trades without redrawing! The indicator uses each candle, analyzing them separately. referring to different impulses - up or down impulse. Exact entry points into transactions for currencies, crypto, metals, stocks, indices!  -  Version MT5               DETAILED DESCRIPTION                R ecommended to use with
    Indicator : RealValueIndicator Description : RealValueIndicator is a powerful tool designed specifically for trading on the EURUSD pair. This indicator analyzes all EUR and USD pairs, calculates their real currency strength values, and displays them as a single realistic value to give you a head start on price. This indicator will tell you moves before they happen if you use it right. RealValueIndicator allows you to get a quick and accurate overview of the EURUSD currency pair tops and bottoms,
    Tanıtım       Kuantum Trend Keskin Nişancı Göstergesi   , trend tersine dönmeleri belirleme ve ticaret yapma şeklinizi değiştiren çığır açan MQL5 Göstergesi! 13 yılı aşkın ticaret tecrübesine sahip deneyimli tüccarlardan oluşan bir ekip tarafından geliştirilmiştir.       Kuantum Trend Keskin Nişancı Göstergesi       trend dönüşlerini son derece yüksek doğrulukla belirlemenin yenilikçi yolu ile ticaret yolculuğunuzu yeni zirvelere taşımak için tasarlanmıştır. ***Kuantum Trend Keskin Nişancı Gö
    TrendMaestro
    Stefano Frisetti
    5 (3)
    note: this indicator is for METATRADER4, if you want the version for METATRADER5 this is the link:  https://www.mql5.com/it/market/product/108106 TRENDMAESTRO ver 2.4 TRENDMAESTRO recognizes a new TREND in the bud, he never makes mistakes. The certainty of identifying a new TREND is priceless. DESCRIPTION TRENDMAESTRO identifies a new TREND in the bud, this indicator examines the volatility, volumes and momentum to identify the moment in which there is an explosion of one or more of these data a
    Atomic Analyst
    Issam Kassas
    5 (3)
    Öncelikle belirtmek gerekir ki bu Ticaret Göstergesi Yeniden Çizim Yapmaz, Gecikmez ve Gecikme Göstermez, bu da hem manuel hem de robot ticareti için ideal hale getirir. Kullanıcı kılavuzu: ayarlar, girişler ve strateji. Atom Analisti, Piyasada Daha İyi Bir Avantaj Bulmak İçin Fiyatın Gücünü ve Momentumunu Kullanan PA Fiyat Hareketi Göstergesidir. Gürültüleri ve Yanlış Sinyalleri Kaldırmaya ve Ticaret Potansiyelini Artırmaya Yardımcı Olan Gelişmiş Filtrelerle Donatılmıştır. Birden fazla katma
    ŞU ANDA %26 INDIRIMLI Yeni Başlayanlar veya Uzman Tüccarlar için En İyi Çözüm! Bu Gösterge benzersiz, yüksek kaliteli ve uygun fiyatlı bir ticaret aracıdır çünkü bir dizi tescilli özellik ve yeni bir formül ekledik. Sadece BİR grafik ile 28 Forex çifti için Döviz Gücünü okuyabilirsiniz! Yeni bir trendin veya scalping fırsatının tam tetik noktasını belirleyebildiğiniz için ticaretinizin nasıl gelişeceğini hayal edin? Kullanım kılavuzu: buraya tıklayın Bu ilk olan, orijinal! Değersiz bir
    M1 Arrow
    Oleg Rodin
    5 (14)
    Piyasanın iki temel ilkesine dayanan bir gün içi stratejisi. Algoritma, ek filtreler kullanarak hacimlerin ve fiyat dalgalarının analizine dayanmaktadır. Göstergenin akıllı algoritması, yalnızca iki piyasa faktörü bir araya geldiğinde bir sinyal verir. Gösterge, daha yüksek zaman çerçevesinin verilerini kullanarak M1 grafiğinde belirli bir aralıktaki dalgaları hesaplar. Ve dalgayı doğrulamak için gösterge, hacme göre analizi kullanır. Bu gösterge hazır bir ticaret sistemidir. Bir tüccarın ihtiya
    Advanced Supply Demand
    Bernhard Schweigert
    4.92 (313)
    CURRENTLY 26% OFF !! Best Solution for any Newbie or Expert Trader! This indicator is a unique, high quality and affordable trading tool because we have incorporated a number of proprietary features and a new formula. With this update, you will be able to show double timeframe zones. You will not only be able to show a higher TF but to show both, the chart TF, PLUS the higher TF: SHOWING NESTED ZONES. All Supply Demand traders will love it. :) Important Information Revealed Maximize the potenti
    Quantum Breakout Indicator PRO
    Bogdan Ion Puscasu
    4.96 (26)
    Tanıtım       Quantum Breakout PRO   , Breakout Bölgeleri ile ticaret yapma şeklinizi değiştiren çığır açan MQL5 Göstergesi! 13 yılı aşkın ticaret deneyimine sahip deneyimli tüccarlardan oluşan bir ekip tarafından geliştirilen   Quantum Breakout PRO   , yenilikçi ve dinamik koparma bölgesi stratejisiyle ticaret yolculuğunuzu yeni zirvelere taşımak için tasarlanmıştır. Kuantum Breakout Göstergesi, size 5 kar hedefi bölgesi ile kırılma bölgelerinde sinyal okları ve kırılma kutusuna dayalı ol
    NAM Order Blocks
    NAM TECH GROUP, CORP.
    5 (1)
    MT4 Multi-timeframe Order Blocks detection indicator. Features - Fully customizable on chart control panel, provides complete interaction. - Hide and show control panel wherever you want. - Detect OBs on multiple timeframes. - Select OBs quantity to display. - Different OBs user interface. - Different filters on OBs. - OB proximity alert. - ADR High and Low lines. - Notification service (Screen alerts | Push notifications). Summary Order block is a market behavior that indicates order collection
    FX Volume
    Daniel Stein
    4.61 (36)
    Sabah Brifingimiz aracılığıyla ayrıntılar ve ekran görüntüleri ile günlük piyasa güncellemenizi alın burada mql5 ve on Telegram ! FX Volume, bir brokerin bakış açısından piyasa duyarlılığı hakkında GERÇEK bir fikir veren İLK ve TEK hacim göstergesidir. COT raporlarından çok daha hızlı bir şekilde, brokerlar gibi kurumsal piyasa katılımcılarının Forex piyasasında nasıl konumlandıklarına dair harika bilgiler sağlar. Bu bilgileri doğrudan grafiğinizde görmek, ticaretiniz için gerçek oyun değiştir
    Enigmera
    Ivan Stefanov
    5 (4)
    ENIGMERA: Pazarın çekirdeği https://www.enigmera.com Giriş Bu gösterge ve ticaret sistemi, finansal piyasalar için dikkate değer bir yaklaşımdır. ENIGMERA, destek ve direnç seviyelerini doğru bir şekilde hesaplamak için fraktal döngüleri kullanır. Gerçek birikim aşamasını gösterir ve yön ve hedefler verir.  İster bir trendde ister bir düzeltmede olalım çalışan bir sistem.  Nasıl çalışır? ENIGMERA üç çizgiden oluşur: destek/direnç çizgisi, hedef çizgisi ve sapma çizgisi. Sistem, geçmiş veril
    TrendDecoder Premium
    Christophe Pa Trouillas
    5 (6)
    Aralıkları ve bir sonraki olası hamleleri belirleyin   |  Trendlerin en erken sinyallerini ve gücünü alın   |  Geri dönüşten önce net çıkışlar alın   |  Fiyatın test edeceği Fibo seviyelerini tespit edin Gecikmesiz, takip edilmeyen gösterge - manuel ve otomatik ticaret için ideal - tüm varlıklar ve tüm zaman birimleri için uygun Sınırlı süreli teklif >>   %50 İNDİRİM Satın aldıktan sonra, kişiselleştirilmiş ayarlar için bu kanaldan benimle iletişime geçin . MT5   sürümü:   buraya tıklayın Tam y
    Cycle Sniper
    Elmira Memish
    4.41 (37)
    NEW YEAR SALE PRICE FOR LIMITED TIME!!! Please contact us after your purchase and we will send you the complimentary indicators to complete the system Cycle Sniper is not a holy grail but when you use it in a system which is explained in the videos, you will feel the difference. If you are not willing to focus on the charts designed with Cycle Sniper and other free tools we provide, we recommend not buying this indicator. We recommend watching the videos about the indiactor and system before pu
    Legacy of Gann
    Pavel Zamoshnikov
    4.85 (13)
    The indicator very accurately determines the levels of the possible end of the trend and profit fixing. The method of determining levels is based on the ideas of W.D.Gann, using an algorithm developed by his follower Kirill Borovsky. Extremely high reliability of reaching levels (according to K. Borovsky  - 80-90%) Indispensable for any trading strategy – every trader needs to determine the exit point from the market! Precisely determines targets on any timeframes and any instruments (forex, met
    All in One Trade
    Alexey Minkov
    4.48 (27)
    The All-in-One Trade Indicator (AOTI) determines daily targets for EURUSD, EURJPY, GBPUSD, USDCHF, EURGBP, EURCAD, EURAUD, AUDJPY, GBPAUD, GBPCAD, GBPCHF, GBPJPY, AUDUSD, and USDJPY. All other modules work with any trading instruments. The indicator includes various features, such as Double Channel trend direction, Price channel, MA Bands, Fibo levels, Climax Bar detection, and others. The AOTI indicator is based on several trading strategies, and created to simplify market analysis. All-in-One
    Currency Strength Wizard , başarılı ticaret için size hepsi bir arada çözüm sağlayan çok güçlü bir göstergedir. Gösterge, birden çok zaman dilimindeki tüm para birimlerinin verilerini kullanarak şu veya bu forex çiftinin gücünü hesaplar. Bu veriler, şu veya bu para biriminin gücünü görmek için kullanabileceğiniz, kullanımı kolay para birimi endeksi ve para birimi güç hatları biçiminde temsil edilir. İhtiyacınız olan tek şey, işlem yapmak istediğiniz tabloya göstergeyi eklemektir ve gösterge size
    TakePropips Donchian Trend Pro
    Eric John Pajarillaga Aldana
    4.61 (18)
    TakePropips Donchian Trend Pro   (MT4), Donchian Kanalı'nı kullanarak trendin yönünü otomatik olarak tespit eden ve size ticarete giriş ve çıkış sinyalleri sağlayan güçlü ve etkili bir araçtır! Bu çok işlevli gösterge, bir trend tarayıcı, ticaret sinyalleri, istatistiksel panel, tarayıcı, ticaret oturumları ve uyarı geçmişi panosu içerir. Size ticaret sinyalleri sağlamak ve çizelgeleri analiz ederek saatlerce tasarruf etmenizi sağlamak için tasarlanmıştır! Kullanım kılavuzunu ve kurulum kılavuzu
    ICT, SMC, SMART MONEY CONCEPTS, SMART MONEY, Smart Money Concept, Support and Resistance, Trend Analysis, Price Action, Market Structure, Order Blocks, BOS/CHoCH,   Breaker Blocks ,  Momentum Shift,   Supply&Demand Zone/Order Blocks , Strong Imbalance, HH/LL/HL/LH,    Fair Value Gap, FVG,  Premium  &   Discount   Zones, Fibonacci Retracement, OTE, Buy Side Liquidity, Sell Side Liquidity, BSL/SSL Taken, Equal Highs & Lows, MTF Dashboard, Multiple Time Frame, BigBar, HTF OB, HTF Market Structure, 
    Entry Points Pro
    Yury Orlov
    4.7 (226)
    Yeniden boyamadan bir ticarete girmek için doğru sinyaller sağlayan MT5 için en iyi gösterge! Herhangi bir finansal varlığa uygulanabilir: forex, kripto para birimleri, metaller, hisse senetleri, endeksler. MT5 versiyonu burada Oldukça doğru alım satım sinyalleri sağlayacak ve bir alım satımı açıp kapatmanın en iyi zamanını size söyleyecektir. Göstergeyi ödeyen yalnızca bir sinyali işleme örneğiyle videoyu (6:22) izleyin! Çoğu tüccar, Giriş Noktaları Pro göstergesinin yardımıyla ilk işl
    Precision Index Osilatörü (Pi-Osc) - Precision Trading Systems'dan Roger Medcalf Sürüm 2, grafiklerinizde hızlı bir şekilde yüklenmek üzere dikkatle yeniden kodlandı ve deneyimi artırmak için bazı teknik geliştirmeler de içerdi. Pi-Osc, herkesin stoplarını almak için zorlanan pazarların gitmek zorunda kaldığı aşırı yorgunluk noktalarını bulmak için tasarlanmış doğru ticaret zamanlama sinyalleri sunmak amacıyla oluşturuldu. Bu ürün, aşırı noktaların nerede olduğunu bilmek gibi yaşlı bir so
    Welcome to the world of SMC (Smart Money Concepts) Trading, where we empower traders with the tools and knowledge to make smarter trading decisions. Our latest addition to our suite of trading tools is the SMC Trading Pro indicator, version 1.0. Key Features: Major Market Structure Identification with BODY break. Order Block must be in Major Swing ( not Small Swing ). Order Block with Fair Value Gap Detection. Order Block in Discount | Premium zone. Filter for only Bullish, Bearish or All Order
    ZeusArrow Smart Liquidity Finder  Smart Liquidity Finder is Ai controlled indicator based on the Idea of Your SL is My Entry. It scan and draws the major Liquidity areas on chart partitioning them with Premium and Discount Zone and allows you find the best possible trading setups and help you decide the perfect entry price to avoid getting your Stop Loss hunted . Now no more confusion about when to enter and where to enter. Benefit from this one of it's kind trading tool powered by Ai an trade
    A. A2SR nedir ?   * Önde gelen bir teknik göstergedir (yeniden boyama yok, gecikme yok). -- Rehberlik : -- https://www.mql5.com/en/blogs/post/734748/page4#comment_16532516 adresinde -- ve https://www.mql5.com/en/users/yohana/blog A2SR, Destek (talep) ve Direnç (arz) seviyelerini belirlemede özel bir tekniğe sahiptir. İnternette gördüğümüz sıradan yoldan farklı olarak A2SR, gerçek SR seviyelerini belirlemede özgün bir konsepte sahiptir. Orijinal teknik internetten alınmadığı gibi internette
    Yazarın diğer ürünleri
    Bermaui Manual EA
    Muhammad Elbermawi
    5 (10)
    Bu, ızgara sistemi ticareti yapan yarı otomatik bir uzman danışmandır. Buradaki fikir, piyasada kademeli olarak farklı pozisyonlar almak ve daha sonra onlar için başa baş seviyesini hesaplamaktır. Fiyatlar bu başabaş noktasını önceden belirlenmiş bir mesafe kadar aştığında, açılan tüm emirler kapanır. Önemli bilgi İşte kullanıcı kılavuzu:   https://www.mql5.com/en/blogs/post/730567 Bu EA'yı diğer ürünlerimden herhangi biriyle burada deneyebilirsiniz: https://www.mql5.com/en/users/bermaui314/
    True Direction Oscillator
    Muhammad Elbermawi
    4.89 (494)
    Veya "Saf Momentum " ilkesini kullanarak fiyat değişim oranını ölçen bir endeks olan (TDO). Bir menkul kıymet fiyatı 10'dan 15'e yükseldiğinde, fiyat değişim oranı %150'dir, ancak 15'ten 10'a düştüğünde, fiyat değişim oranı sadece %33.3'tür. Bu nedenle, "Fiyat Değişim Oranı" (ROC) veya "Momentum" gibi teknik analiz göstergeleri, artan fiyat hareketleri için azalan hareketlere göre daha yüksek değerler verir. TDO, yatırımcıların momentumu doğru okumalarına yardımcı olmak için bu sorunu düzeltir
    MASR Bands
    Muhammad Elbermawi
    4.64 (11)
    Ya da E Oving bir verage S upport R esistance Gruplar. MASR Bantları göstergesi, destek ve direnç seviyeleri olarak birlikte çalışan iki bantla çevrili hareketli bir ortalamadır. İstatistiksel olarak, MASR Bantları zamanın %93'ünde fiyat mumları içerir. Adımlarda şu şekilde hesaplanır: 1. İlk adım, bir X dönemi için en yüksek yüksek (HHV) ve en düşük düşük (LLV) hesaplamaktır. 2. İkinci adım, aralarındaki mesafenin yüzde olarak ne kadar geniş olduğunu bulmak için HHV'yi LLV'ye bölmektir.
    Bermaui Deviation Percent
    Muhammad Elbermawi
    4.94 (129)
    Veya oynaklığı puan yerine yüzde olarak ölçen bir oynaklık endeksi olan ( BD% ). BD% fikri, yüzde 0 ile 100 arasında hareket eden Klasik Standart Sapma'ya (CSD) bağlı bir endeks yapmaktır. Farklı zaman dilimlerinde veya farklı zaman dilimlerinde aynı güvenlik için oynaklığı karşılaştırmak için BD%'yi kullanabilirsiniz. Ayrıca, farklı piyasalardaki farklı menkul kıymetler arasındaki oynaklığı puan yerine yüzde cinsinden karşılaştırmak için BD%'yi kullanabilirsiniz. "BD%" NASIL KULLANILIR
    Bermaui Bands
    Muhammad Elbermawi
    4.94 (90)
    Bermaui Bantları (BB), değişen ve trend olan fiyat hareketleri arasında filtrelemeye yardımcı olan bir teknik analiz aracıdır. Bu göstergenin arkasındaki fikir, sonraki adımlarda açıklanabilir: 0 ile 100 arasında hareket eden bir osilatör olarak Standart Sapmayı hesaplayın. Ben buna Bermaui Sapma yüzdesi (BD %) adını vereceğim. "BD %" sıfıra yakınsa, oynaklık en uç noktadadır. Ayrıca "BD %" 100'e yakınsa oynaklık çok düşüktür. Yüksek oynaklık, trend olan bir piyasa için büyük bir olasılık anlamı
    Bermaui Pin Bars
    Muhammad Elbermawi
    5 (22)
    Bermaui Pim Çubukları Veya (BPB), grafikte Pin Bar fiyat hareket modelini bulan bir göstergedir. Pin Barlar, Hammer, Inverted-Hammer, Hanging Man, Shooting Star, Dragon Fly Doji veya Grave Stone Doji gibi uzun üst veya alt gölgeli ve çok küçük gövdeli Japon şamdanlarına alternatif olan klasik bir çubuk deseni olan "Pinokyo Çubukları" için bir kısayoldur. . Bermaui Pin Bars göstergesi, sonraki adımlarda açıklanabilecek bir formüle bağlı olarak bu kalıbı bulur: İlk BPB'de mum gövdesinin merkez
    Bermaui RSI Candles
    Muhammad Elbermawi
    5 (7)
    Bu göstergenin fikri, alım ve satım sinyalleri oluşturmak için fiyat çizelgeleri ile karşılaştırılabilecek mum şeklinde RSI çizmektir. Gösterge benim buluşum değil. Birkaç yıl önce internette kurdum. Kodu güncelledim, uyarı işlevleri ekledim, Bermaui Utilities araç grubunu ekledim. Gösterge, mum çubukları çizmek için kullanılan tüm fiyatların RSI'sını hesaplar (açık, yüksek, düşük ve kapalı RSI). RSI mumlarını yüksek fitili çekmek için en yükseklerini ve RSI mumlarını düşük fitili çekmek için
    Classic Keltner Channel
    Muhammad Elbermawi
    4.9 (40)
    Veya CKC. Bu gösterge, Chester W. Keltner (1909–1998) tarafından tanımlanan klasik on günlük hareketli ortalama kuralına bağlı olarak çalışır. Tüm parametreler varsayılan olarak Keltner sisteminin klasik versiyonuna ayarlanmıştır, kullanıcı isterse bunları değiştirebilir. Önemli bilgi CKC Kılavuzunu okuyun: https://www.mql5.com/en/blogs/post/736577 CKC Uzman Danışman Örneği: https://www.mql5.com/en/blogs/post/734150 Keltner Kanal Formülü Hakkında 1. Merkez Çizgiyi, Tipik Fiyattan (= (Yüks
    BACD Cloud
    Muhammad Elbermawi
    4.57 (7)
    Ya da yüzde olarak göstermektedir eğilim yönü ve önlemler gücünü olduğu bir osilatördür B ermaui bir verage Cı onvergence D ivergence bulut. BACD Bulut hesaplaması aşağıdaki gibidir: 1- İki üstel hareketli ortalamayı hesaplayın. Bunlardan biri diğerinden daha hızlıdır. İlkini (Hızlı) ve ikincisini (Yavaş) arayacağım 2- Aralarındaki merkezi bulun, burada: Merkez MA = (Hızlı + Yavaş) / 2 3- BACD Çizgisini aşağıdaki gibi hesaplayın: BACD = 100 * (Hızlı / Merkez MA) 4- BACD'nin üstel hareke
    Or DBD%. The indicator consists of colored tape that shows trading signals depending on two Bermaui Deviation Oscillator (BD%) and two moving averages. Bermaui Deviation Percent is a volatility index that measures volatility in percent rather than points. The idea of BD% is to make an index depending on Classic Standard Deviation (CSD) that moves between 0 and 100 percent. Important Information DBD% expert advisor example:  https://www.mql5.com/en/blogs/post/731145 If you want to know mor
    Bermaui Channel
    Muhammad Elbermawi
    5 (27)
    This is a price channel that shows five important price levels on the chart. Those levels are: 1. The Highest High (HH) of the previous x bars. 2. The Highest Low (HL) of the previous x bars. 3. The Center Line. 4. The Lowest High (LH) of the previous x bars. 5. The Lowest Low (LL) of the previous x bars. How does Bermaui Channels Captures Overbought  area Think of the distance between HH and HL levels as an overbought area. When the price candles or bars crosses the HL to the upside this
    Horus EA
    Muhammad Elbermawi
    3.67 (3)
    MT4 için Horus EA Binlerce yıl önce, eski Mısırlılar topraklarını ölçmek ve mallarını tartmak için kullandıkları bir sayma sistemi icat ettiler. Bu sistem " Horus'un Gözü " olarak biliniyordu. Horus'un Gözü, tanrı Osiris efsanesiyle ilişkilendirildi ve firavunların kutsal sembollerinden biri oldu. Ünlü "Martingale Sistemi"nden %89 daha güvenli olan negatif ilerlemeli bir para yönetim sistemi oluşturmak için Horus'un Gözü'ndeki Fibonacci dizisiyle matematiksel denklemleri kullandım. EA'nın te
    Filtrele:
    davevicens
    321
    davevicens 2023.10.17 16:39 
     

    An execellent indicator. First trade First win!! Good Job

    awasthisp
    764
    awasthisp 2023.08.20 09:53 
     

    This is an execellent indicator. it does give a big help to get more successful trades. Good job

    Muhammad Elbermawi
    52350
    Geliştiriciden yanıt Muhammad Elbermawi 2023.08.20 10:01
    Thanks a lot for the great review 💚🙏
    Hisham Ghoneim
    301
    Hisham Ghoneim 2022.08.18 10:39 
     

    Great work as usual

    [Silindi] 2021.03.21 22:25 
     

    Kullanıcı incelemeye herhangi bir yorum bırakmadı

    Brandon Kyle Fricke
    485
    Brandon Kyle Fricke 2021.03.16 20:13 
     

    Great confirmation to my current strategy

    Paulina Andrea Madariaga Figueroa
    4147
     

    Best indicators

    Mohamed Osman
    184
    Mohamed Osman 2020.11.28 17:45 
     

    I love it

    jaugusto111
    326
    jaugusto111 2020.10.23 11:26 
     

    Indicador muito bom e completo, basta saber filtrar os sinais de entrada, para ter bons resultados. Muito obrigado Srº Muhammad por desenvolver indicadores tão bons a preços acessíveis.

    Malcolm David Parker
    475
    Malcolm David Parker 2020.07.23 21:29 
     

    Looking good so far.

    lauro1956
    4476
    lauro1956 2020.07.19 17:59 
     

    good morning Very good indicator Thank you

    allname29
    239
    allname29 2020.07.19 10:51 
     

    excellent indicator, I like 👍⭐⭐⭐⭐⭐

    z354x2
    137
    z354x2 2020.07.19 09:34 
     

    This indicator works great, and the support is terrific, too!

    Ferrari888
    593
    Ferrari888 2020.07.03 20:58 
     

    Очень хороший индикатор советую! Спасибо Мухаммад что Вы есть.

    jxdxpolo22
    401
    jxdxpolo22 2020.06.20 23:38 
     

    Simple Indicator to use. It works well.

    IK°L
    815
    IK°L 2020.06.13 03:02 
     

    This is an indicator that you have to have, simple but enormously well developed the idea graphically, great indicator !!

    Lasse Michael Holm
    1318
    Lasse Michael Holm 2020.06.07 22:51 
     

    At last, an indicator that works for me. 10 stars! Just grab this one 😃👍

    Frank Paetsch
    7117
    Frank Paetsch 2019.05.16 01:51 
     

    Sehr schöner Indikator

    Mohamed Trader
    309
    Mohamed Trader 2019.01.04 22:48 
     

    Kullanıcı incelemeye herhangi bir yorum bırakmadı

    İncelemeye yanıt
    Sürüm 3.1 2020.07.30
    A small bug in the vertical lines code was fixed.
    Sürüm 3.0 2020.07.14
    Welcome to MAC version 3.0:
    ------------------------------------
    1) I have enhanced the alert and notifications to work better with the MT4 system tester.
    2) The "MAC Cloud Width" now changes automatically depending on the chart scale.
    .
    Note:
    -------
    I didn't make any changes to the MAC's basic formula. It is still the same.
    Sürüm 2.1 2020.03.02
    Fixed a small text error in the description.
    Sürüm 2.0 2020.03.02
    1. Enhanced the calculation method.
    2. Added color lists, for a better chart view.
    3. Enhanced all the alerts.
    4. Arranged the inputs to be more user friendly.
    5. Added buffers to indicator description.
    6. Added a buffer for Arrow Signals (buffer #4).
    .
    Note:

    I didn't make any changes on MAC basic formula. It is still the same.