Custom Panel
- Göstergeler
- Marcin Konieczny
- Sürüm: 1.2
- Güncellendi: 7 Kasım 2018
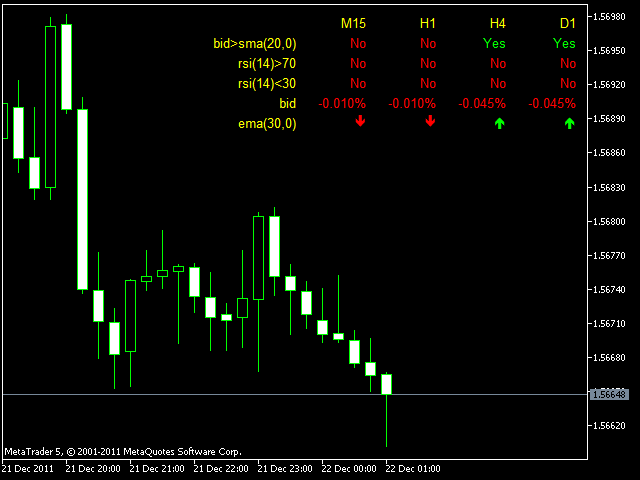
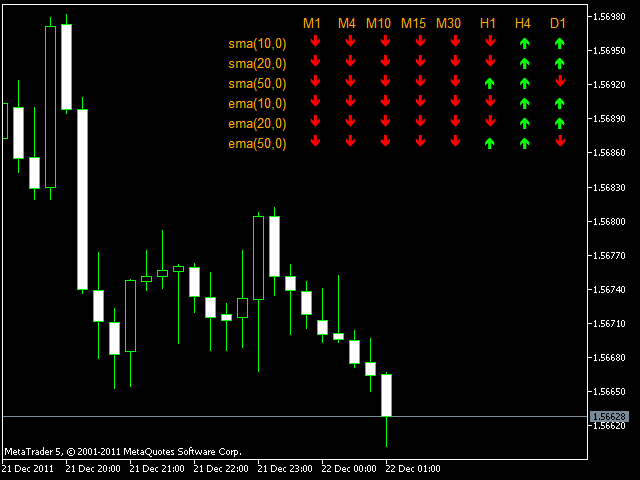
Custom Panel allows you to gather all kind of important information and display it as one handy table in the upper right corner of the chart.
You can choose the contents of the panel yourself. Every row will show your own customized condition or value. Every column shows a different timeframe. The panel may contain up to 10 rows and up to 8 columns.
Sample usage
Row: Price > EMA(30)
Mode: YES_NO
Meaning: is current price above EMA(30)
Row: Ask < Bands[L]
Mode: YES_NO
Meaning: is current ask price below lower Bollinger band
Row: CCI(16)
Mode: PERCENT
Meaning: what is the percent change of CCI(16) from the previous bar close
Row: MACD[S](12,20,10)
Mode: ARROWS
Meaning: is MACD(12,20,10) signal line going up or down
Row: Stoch[M] > Stoch[S]
Mode: YES_NO
Meaning: is Stochastic main line above Stochastic signal line
Row: Bid
Mode: CHANGE
Meaning: what is the change in bid price from the previous bar close
Detailed information
Every row of the panel can work in one of 5 modes:
- YES_NO - showing YES or NO basing on your custom condition (e.g. Price > SMA(30), RSI(14) < 30, EMA(5) > EMA(10), ...). You can use '<', '>' and '=' operators.
- VALUE - simply showing current value of an indicator or current price
- CHANGE - showing the change of price or indicator value between the previous and the current bar PERCENT - the same as in CHANGE mode, but displayed as a percent
- ARROWS - the same as in CHANGE mode, but only up or down arrow is displayed
In YES_NO mode exactly one operator (<,>,=) must be used. In all other modes operators are forbidden.
The panel supports the following built-in indicators:
- Moving averages (SMA, EMA, SMMA and LWMA)
- Relative Strength Index (RSI)
- Commodity Channel Index (CCI)
- MACD
- Stochastic Oscillator (Stoch)
- Parabolic SAR
- Williams Percent Range (WPR, %R)
- Triple Exponential Average (TRIX)
- Bollinger Bands
- Standard Deviation (StdDev)
- Average True Range (ATR)
- Momentum Oscillator (MOM)
- Relative Vigor Index (RVI)
- Average Directional Movement Index (ADX)
The panel recognizes only the following functions. Letter case does not matter. The parameters supplied in brackets can be omitted. The parameters, which are not specified, will be set to default values. For example, it is possible to specify only the first one or the first and the second or all three or none.
- P or PRICE or BID -> shows bid price
- ASK -> shows ask price
- any number, e.g. 20, 1.4506, -100, ...
- CCI(period)
- RSI(period)
- MACD(fast ema, slow ema, macd ema) -> shows MACD main line
- MACD[M](fast ema, slow ema, macd ema) -> shows MACD main line
- MACD[S](fast ema, slow ema, macd ema) -> shows MACD signal line
- MA(period, shift) -> shows SMA by default
- SMA(period, shift)
- EMA(period, shift)
- SMMA(period, shift)
- LWMA(period, shift)
- STOCH(%K, %D, slowing) -> shows Stochastic main line
- STOCH[M](%K, %D, slowing) -> shows Stochastic main line
- STOCH[S](%K, %D, slowing) -> shows Stochastic signal line
- SAR(step, maximum) or PSAR(step, maximum) -> shows Parabolic SAR
- WPR(period) or %R(period)
- TRIX(period)
- BANDS[U](period, shift, deviation) or BB[U](period, shift, deviation) -> shows upper Bollinger band
- BANDS[L](period, shift, deviation) or BB[L](period, shift, deviation) -> shows lower Bollinger band
- STDDEV(period, shift) or DEV(period, shift)
- ATR(period)
- MOM(period)
- RVI(period) or RVI[M](period) -> shows RVI main line
- RVI[S](period) -> shows RVI signal line
- ADX(period) -> shows main ADX line
- ADX[DI+](period) -> shows DI+ line
- ADX[DI-](period) -> shows DI- line


I just love it! Simple to configure, very versatile, small size. Great work! Thanks