PZ Oscillator MT5
- Göstergeler
- PZ TRADING SLU
- Sürüm: 4.0
- Güncellendi: 11 Ağustos 2019
- Etkinleştirmeler: 20
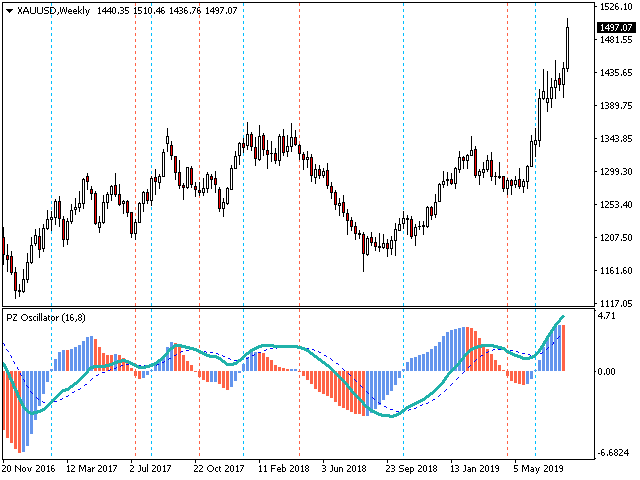
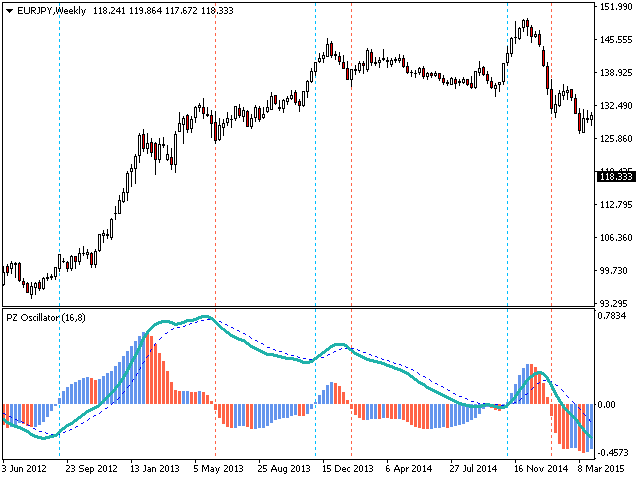
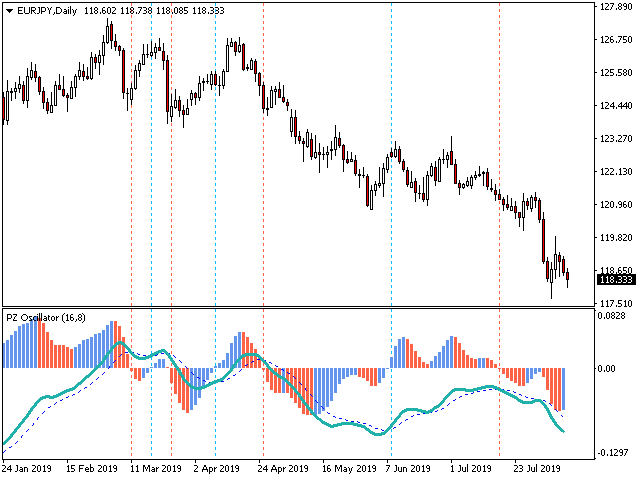
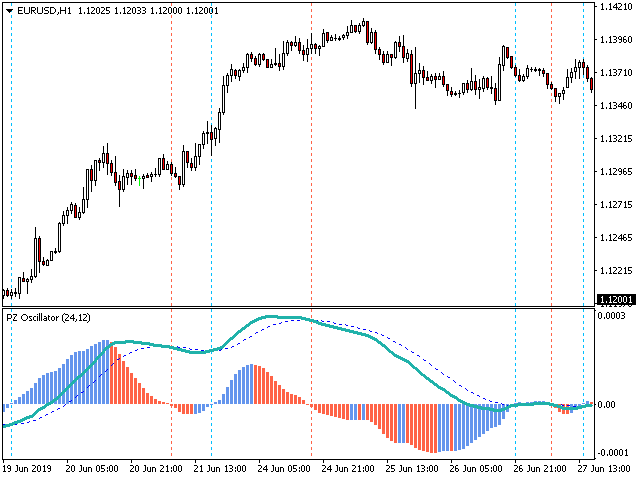
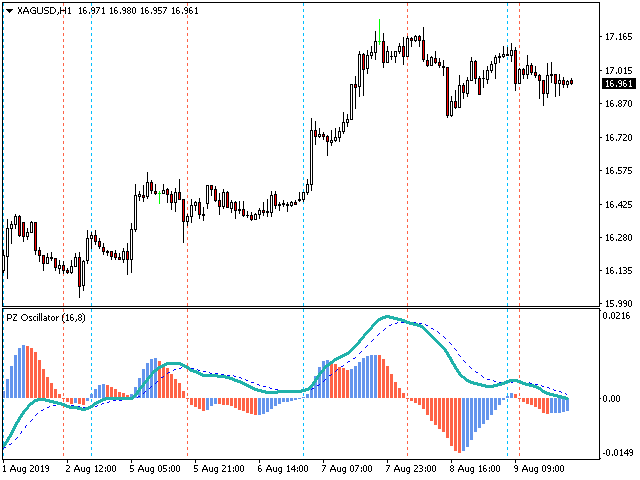
This is a smooth and responsive accelerometer which reveals the market trend and strength.
[ Installation Guide | Update Guide | Troubleshooting | FAQ | All Products ]
- Two moving averages indicate trend direction
- The histogram represents strength of the price movement
- It draws buy and sell zones as colored vertical lines
- Should be used as a confirmation indicator
- Customizable line widths and colors
- It implements alerts of all kinds
This indicator is similar to MACD but aims to react faster to price changes.
Input Parameters
- Period: Period in bars for the oscillator
- Averaging: Averaging period for the oscillator
- Max History Bars: Amount of past bars to evaluate upon loading
- Display Zones: Enable or disable vertical buy and sell zones
- Alerts: Enable or disable alerts of all kinds
Author
Arturo López Pérez, private investor and speculator, software engineer and founder of Point Zero Trading Solutions.


Kullanıcı incelemeye herhangi bir yorum bırakmadı