Advanced Power Trend
- Göstergeler
- Sergey Efimenko
- Sürüm: 1.2
- Güncellendi: 8 Nisan 2020
- Etkinleştirmeler: 10
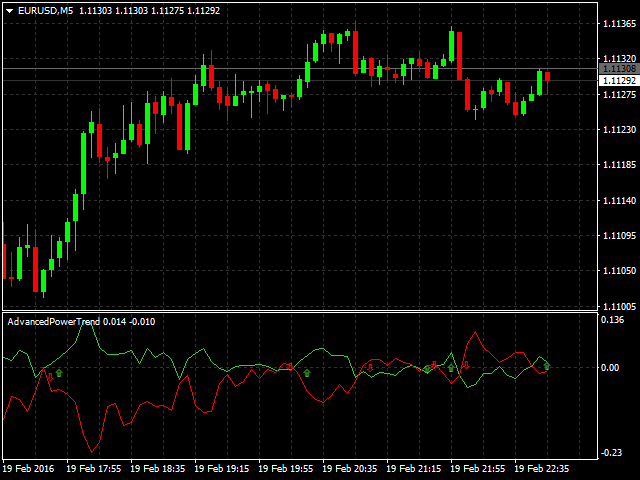
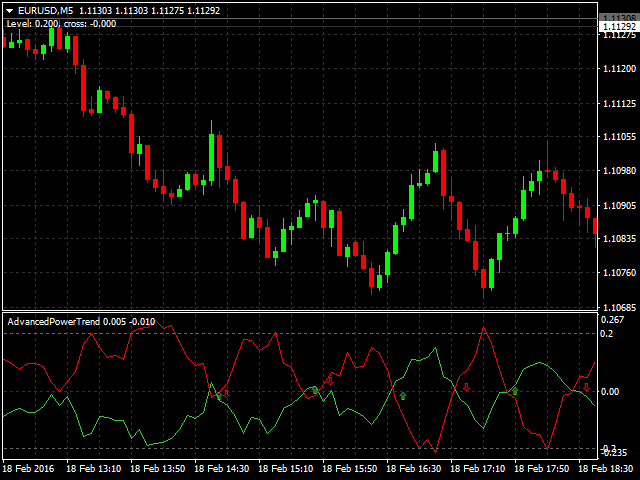
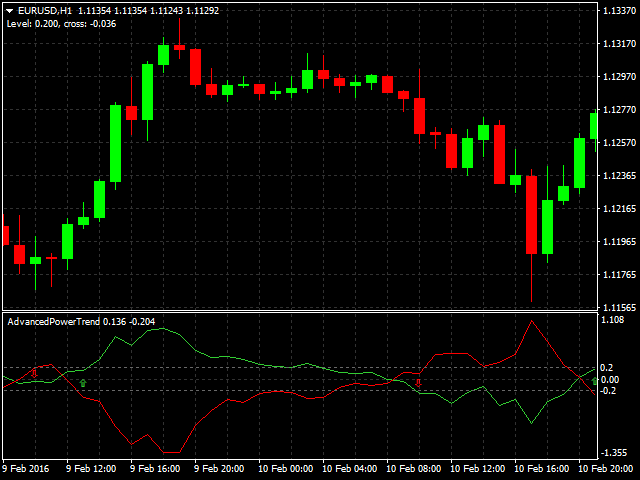
Ortaya çıkan çizgilerin çok katmanlı düzleştirilmesi ve geniş bir parametre seçimi özelliğine sahip benzersiz "ölçeklendirme" trend göstergesi. Trendde olası bir değişikliğin veya hareketin hemen hemen başlangıcına yakın bir düzeltmenin belirlenmesine yardımcı olur. Değiştirilen kesişme okları sabittir ve yeni bir çubuğun açılışında görünür, ancak yeterli deneyime sahipseniz, gösterge çizgileri bitmemiş çubukta kesiştiği anda giriş fırsatlarını aramak mümkündür. Sinyal görünüm sınırı seviyeleri, ek bir filtreleme olarak göstergeye eklenir.
parametreler:- PeriodMA - birincil hareketli ortalama hesaplama dönemi
- MethodMA - birincil hareketli ortalama hesaplama yöntemi
- PriceMA - birincil hareketli ortalama hesaplaması uygulanan fiyat
- BasePeriod - temel eğilim dönemi
- BaseMethod - temel eğilim çizgisinin ortalama alma yöntemi
- BasePrice - temel eğilim çizgisinin uygulanan fiyatı
- PowerPeriod - trend gücü hesaplama dönemi
- PowerPrice - trend gücü hesaplama fiyatı
- PeriodBaseSmooth - trend çizgisinin ek düzgünleştirme dönemi
- BaseLineSmoothMethod - trend çizgisinin ek düzleştirme yöntemi
- PeriodPowerSmooth - güç çizgisinin ek düzleştirme süresi
- PoweLineSmoothMethod - mukavemet çizgisinin ek düzleştirme yöntemi
- ShowArrows - kesişme oklarının görüntülenmesini etkinleştir
- Levels - kesişme oklarını görüntülerken ek filtreleme düzeyleri
- ShowInitialLevels - sıfır olmayan bir değerde grafikte göstergenin otomatik olarak çizilmesini etkinleştir
- ShowCrossCalcComment - çizgilerin olası kesişme noktasının mevcut değeri hakkında bildirimi etkinleştir
- ArrowUpCode - yukarı ok kodu
- ArrowDnCode - aşağı ok kodu
- AddDigits - ek okuma hassasiyetini etkinleştirin

Kullanıcı incelemeye herhangi bir yorum bırakmadı