Average Daily Range ADR Indicator MT4
- Göstergeler
- Eda Kaya
- Sürüm: 1.3
Average Daily Range (ADR) Indicator for MetaTrader 4
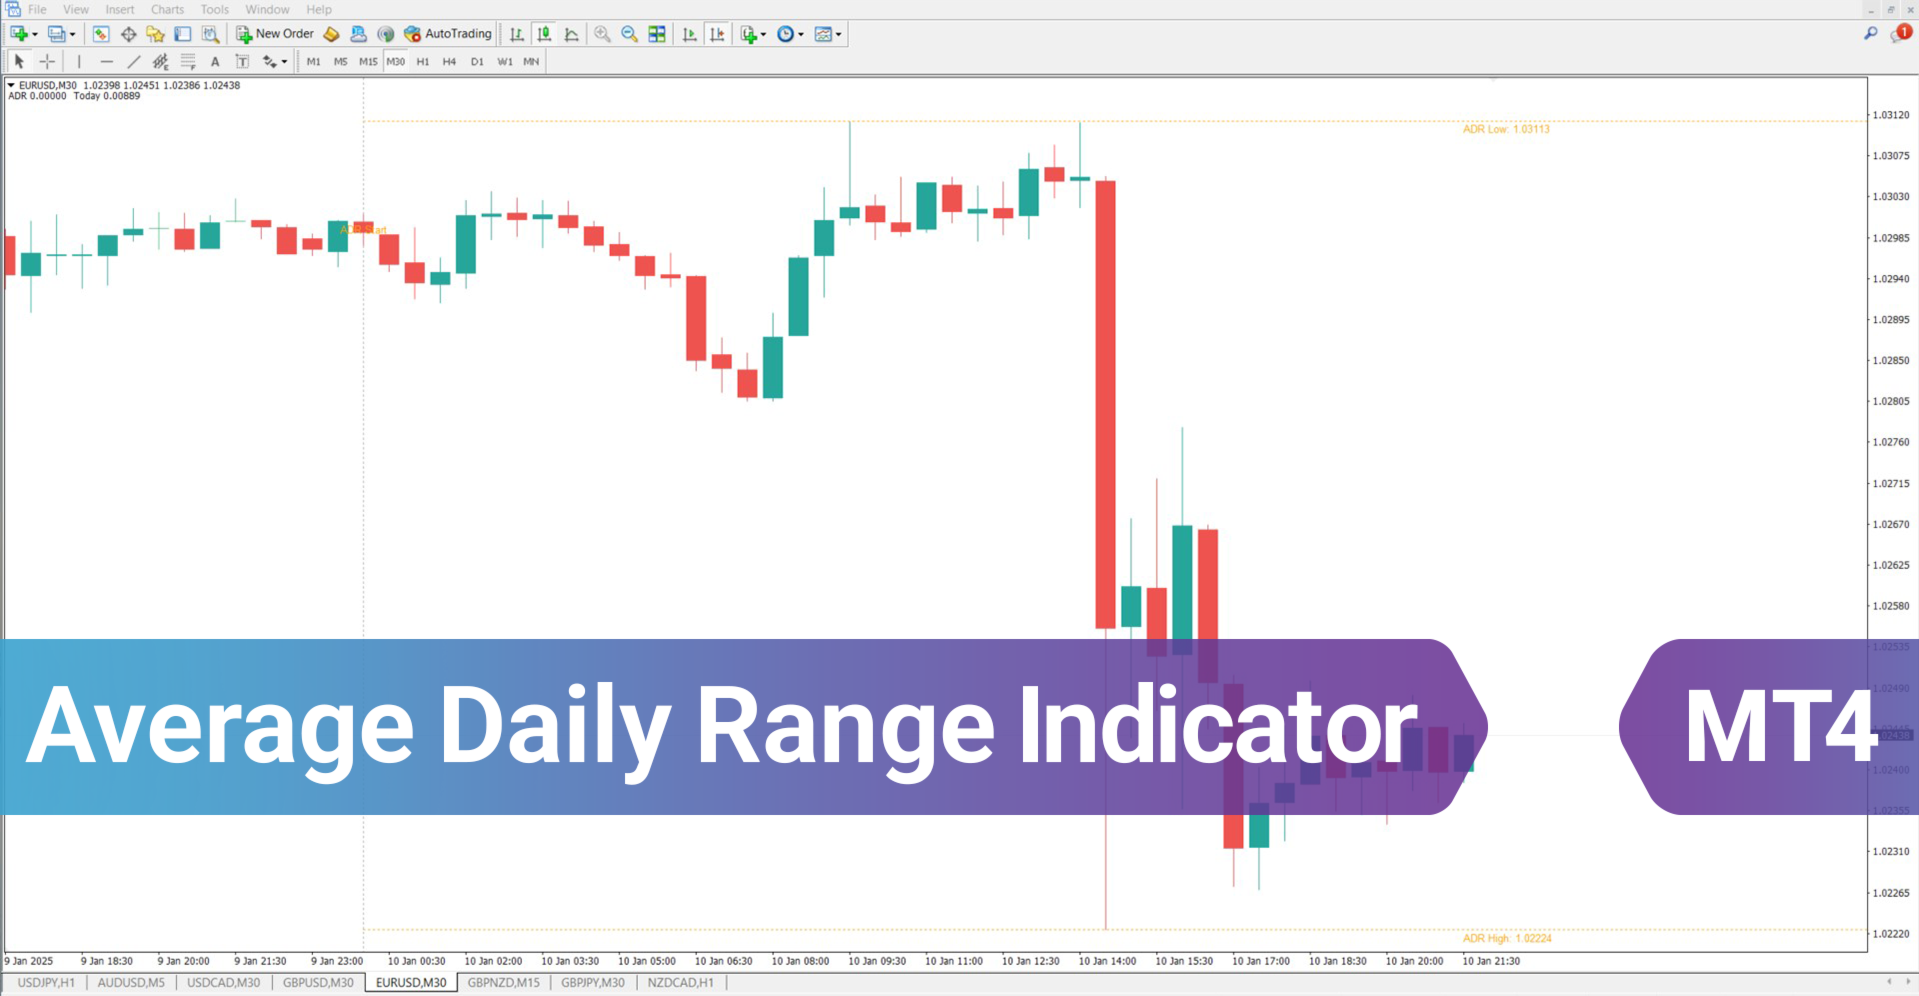
The Average Daily Range (ADR) Indicator for MetaTrader 4 is a vital technical analysis tool used to assess the typical price movement range an asset experience during a trading day.
By analyzing the average distance between daily highs and lows over a specified number of days, this indicator defines the ADR High (upper boundary) and ADR Low (lower boundary), helping traders identify possible support and resistance zones.
«Indicator Installation & User Guide»
MT4 Indicator Installation | Average Daily Range ADR Indicator MT5 | ALL Products By TradingFinderLab | Best MT4 Indicator: Refined Order Block Indicator for MT4 | Best MT4 Utility: Trade Assistant Expert TF MT4 | TP & SL Tool: Risk Reward Ratio Calculator RRR MT4 | Money Management: Easy Trade Manager MT4
Indicator Specifications Table
This table highlights the essential characteristics of the ADR indicator:
| Category | Trading Utility - Support/Resistance - Risk Strategy |
| Platform | MetaTrader 4 |
| Skill Level | Intermediate |
| Indicator Type | Range-Based - Reversal Detection |
| Timeframe | Compatible with Multiple Timeframes |
| Trading Style | Intraday Approach |
| Market | Forex - Crypto Assets - Equity Markets |
Overview of the Indicator
The ADR Indicator derives the average daily volatility of an instrument by processing candlestick highs and lows across a user-defined lookback period.
It assists traders in spotting crucial price boundaries, enhancing the accuracy of trend analysis and entry/exit decisions.
Understanding volatility shifts can help pinpoint reliable zones where price may react strongly.
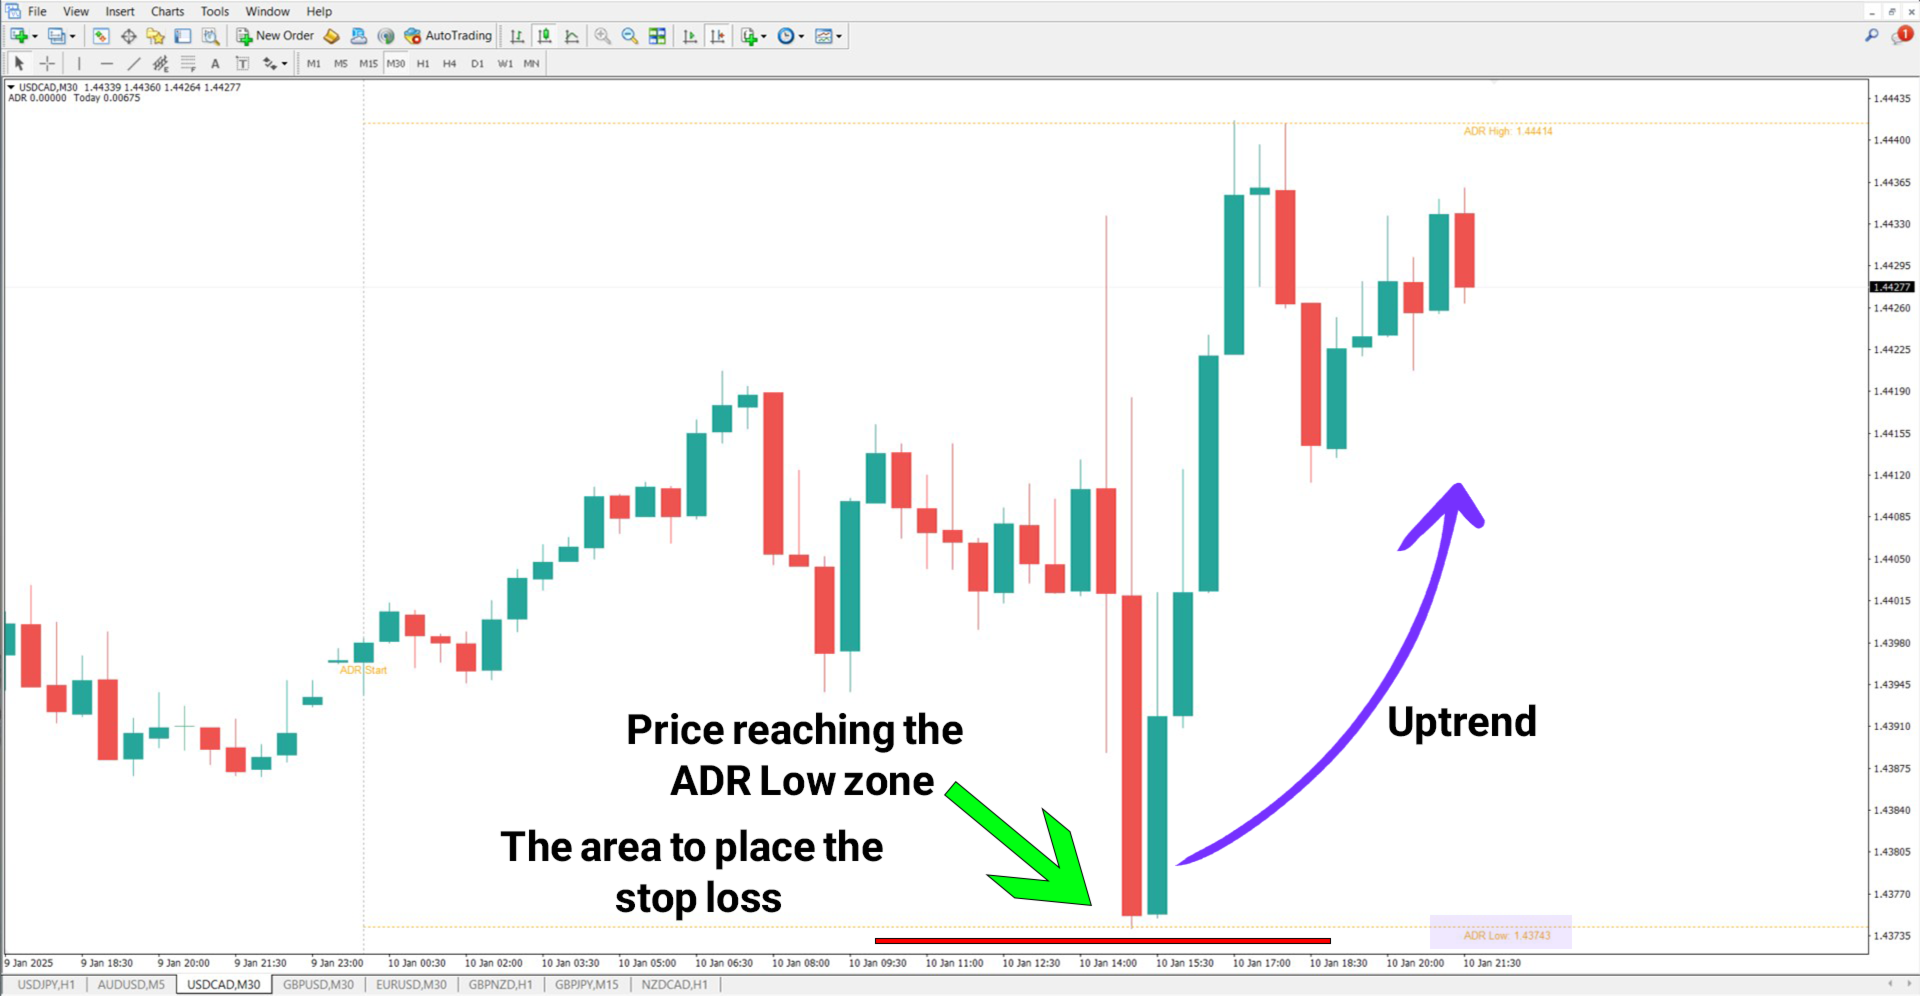
ADR in an Uptrend
For instance, on a 30-minute chart of USD/CAD, when price nears the ADR Low threshold, selling interest may fade, potentially prompting a reversal to the upside.
If bullish candlestick patterns emerge around this level, traders might look for buy entries. Stop-loss placement below the ADR Low is considered a prudent risk control step.
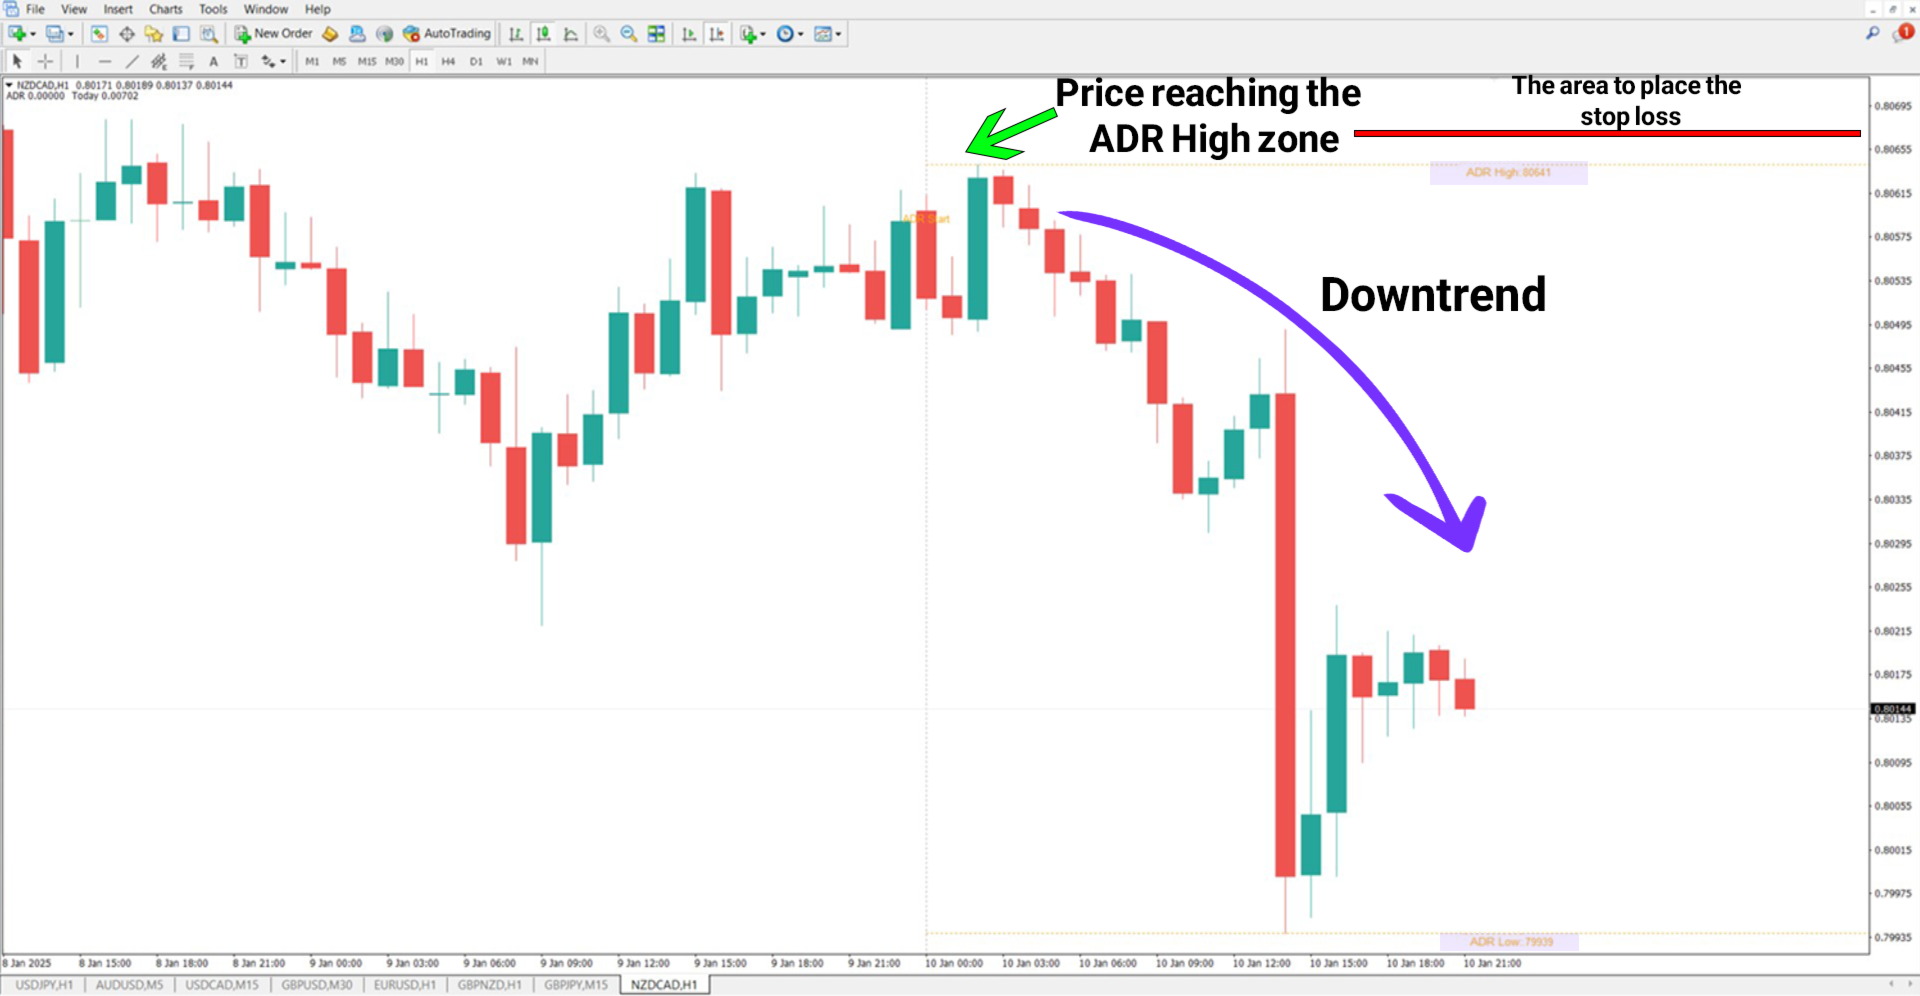
ADR in a Downtrend
Conversely, in a downtrend scenario on the NZD/CAD chart, price action tends to reverse after hitting the ADR High boundary.
Monitoring this zone for bearish price action patterns allows traders to consider short entries, with stop-loss orders positioned slightly above the ADR High for safety.
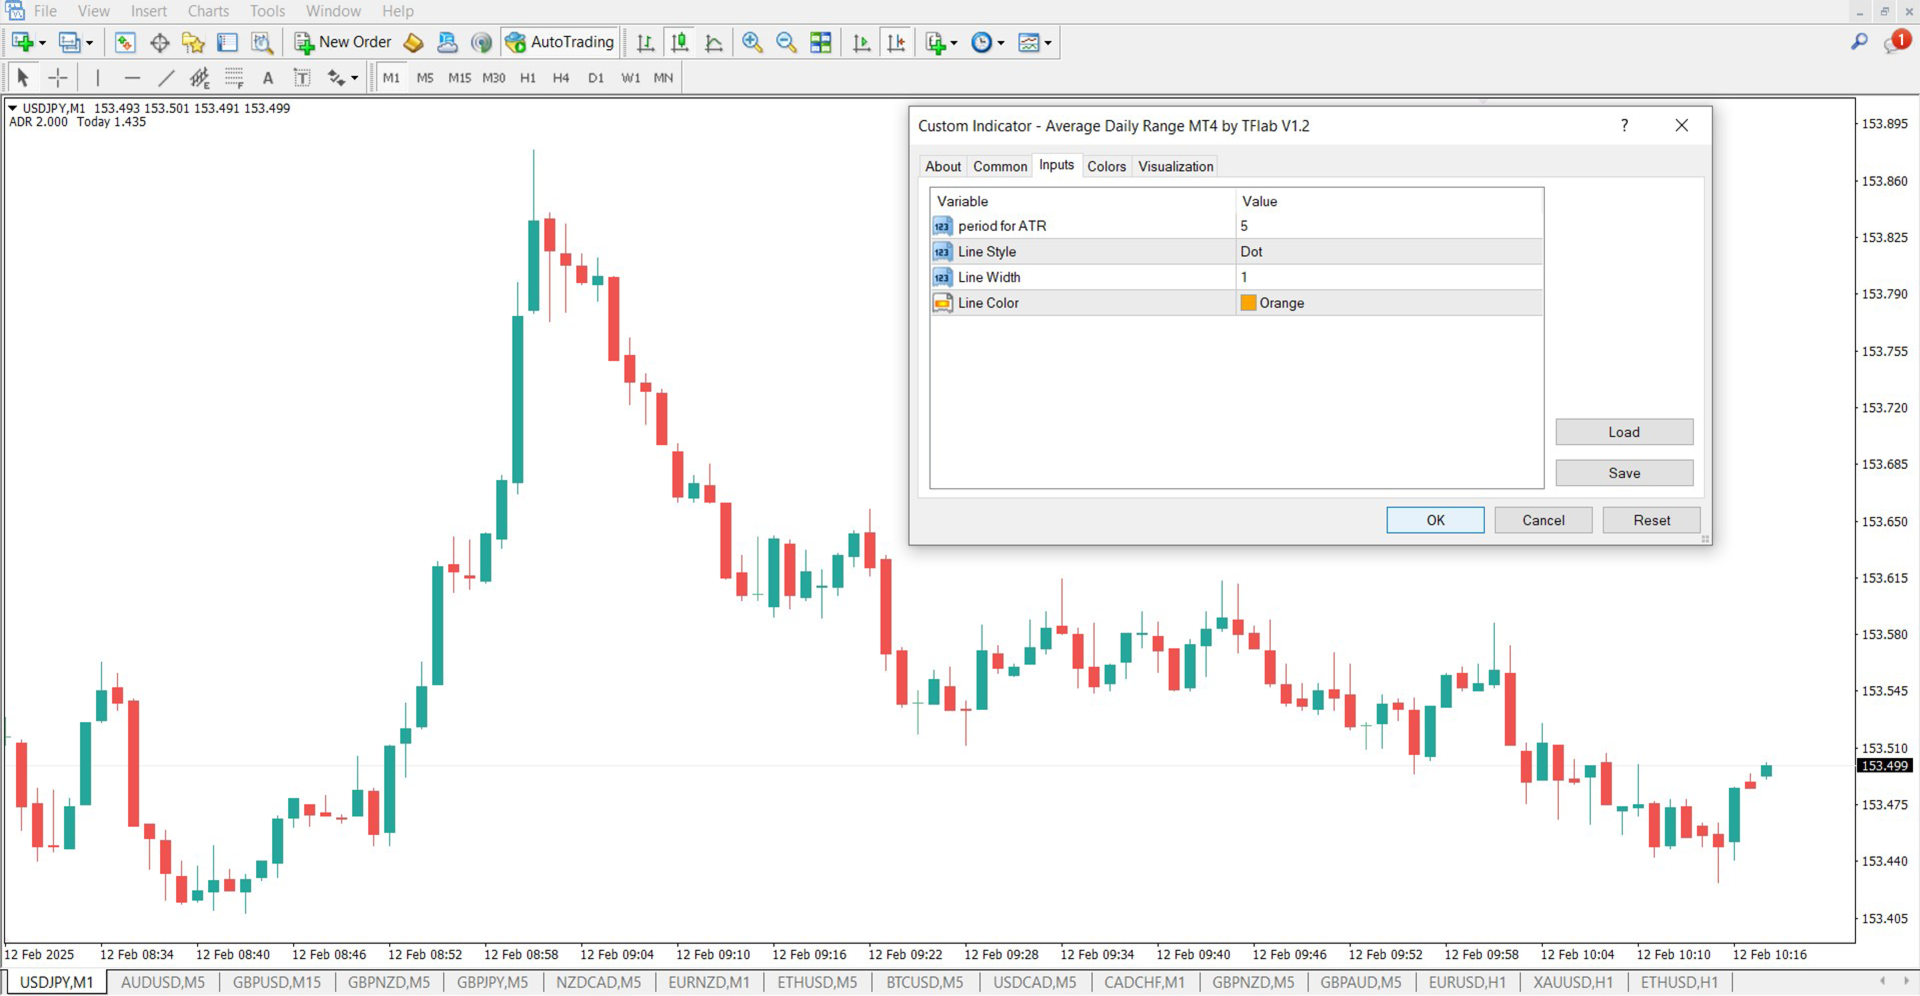
ADR Indicator Settings
Below are the core parameters that can be modified in the ADR Indicator:
- ATR Period: Sets the number of periods for the average true range calculation
- Line Design: Configures the appearance of the plotted lines
- Line Thickness: Controls the width of ADR range levels
- Color Options: Allows customization of the visual lines on the chart
Conclusion
The Average Daily Range (ADR) Indicator for MetaTrader 4 delivers valuable insights into market volatility, making it an excellent resource for identifying potential turning points and important price zones.
Incorporating ADR into your analysis improves overall trading strategy by enhancing precision in stop-loss and take-profit planning.
For deeper market context, combining ADR levels with market sentiment tools—such as volume or momentum indicators—can further sharpen trade setups and timing.