Trend Wave Analyzer
- Yardımcı programlar
- Rong Bin Su
- Sürüm: 1.0
- Etkinleştirmeler: 5
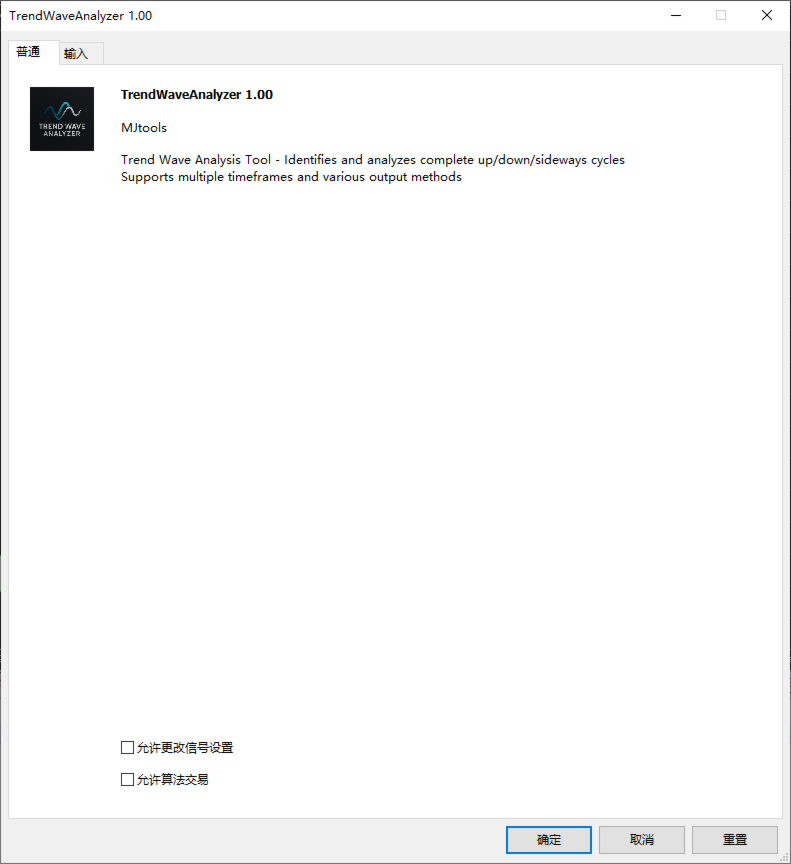
Trend Wave Analyzer
Overview
The Trend Wave Analyzer is a specialized MQL5 tool designed for MetaTrader 5 that identifies,analyzes,and visualizes price trend cycles in financial markets.It detects complete up/down/sideways price movements by identifying key turning points(peaks and troughs)in price action,providing traders with valuable insights into market behavior patterns.
#Key Features
-Multi-symbol Analysis:Analyze multiple trading instruments simultaneously
-Trend Identification:Automatically detects uptrends,downtrends,and sideways market conditions
-Wave Measurement:Quantifies the size and duration of each price movement
-Statistical Analysis:Calculates average and maximum wave sizes for each trend type
-Visual Representation:Displays trends directly on charts with color-coded visualization
-Data Export:Saves detailed trend data to CSV files for further analysis
-Customizable Parameters:Adjustable settings for trend detection sensitivity and analysis conditions
#Technical Approach
The tool employs a systematic peak-and-trough detection algorithm to identify potential reversal points in the price series.It then analyzes the relationships between these points to determine the direction,strength,and magnitude of each trend segment.Advanced filtering options help eliminate noise and focus on statistically significant price movements.
Installation
1.Download the TrendWaveAnalyzer.ex5 file
2.Open MetaTrader 5 platform
3.Navigate to File→Open Data Folder
4.Place the file in the MQL5/Scripts folder
5.Restart MetaTrader 5 or refresh the Navigator panel
6.The script will appear in the Navigator under"Scripts"
Running the Analysis
1.Open a chart for any symbol you wish to analyze
2.Double-click on the TrendWaveAnalyzer script in the Navigator panel
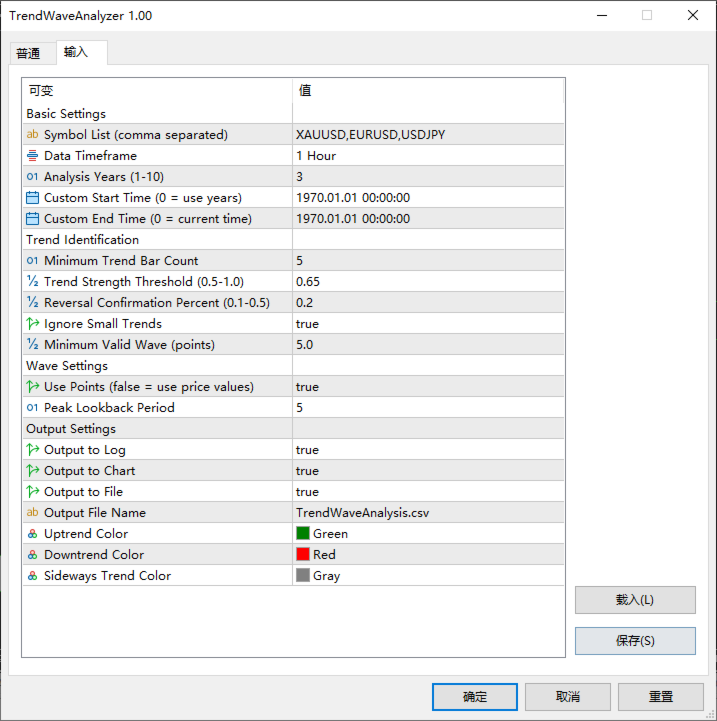
3.Configure the input parameters in the dialog that appears:
-Basic Settings:Define symbols to analyze,timeframe,and time range
-Trend Identification:Set the sensitivity for trend detection
-Wave Settings:Configure how waves are measured
-Output Settings:Select desired output methods and visualization options
4.Click"OK"to start the analysis
Interpreting Results
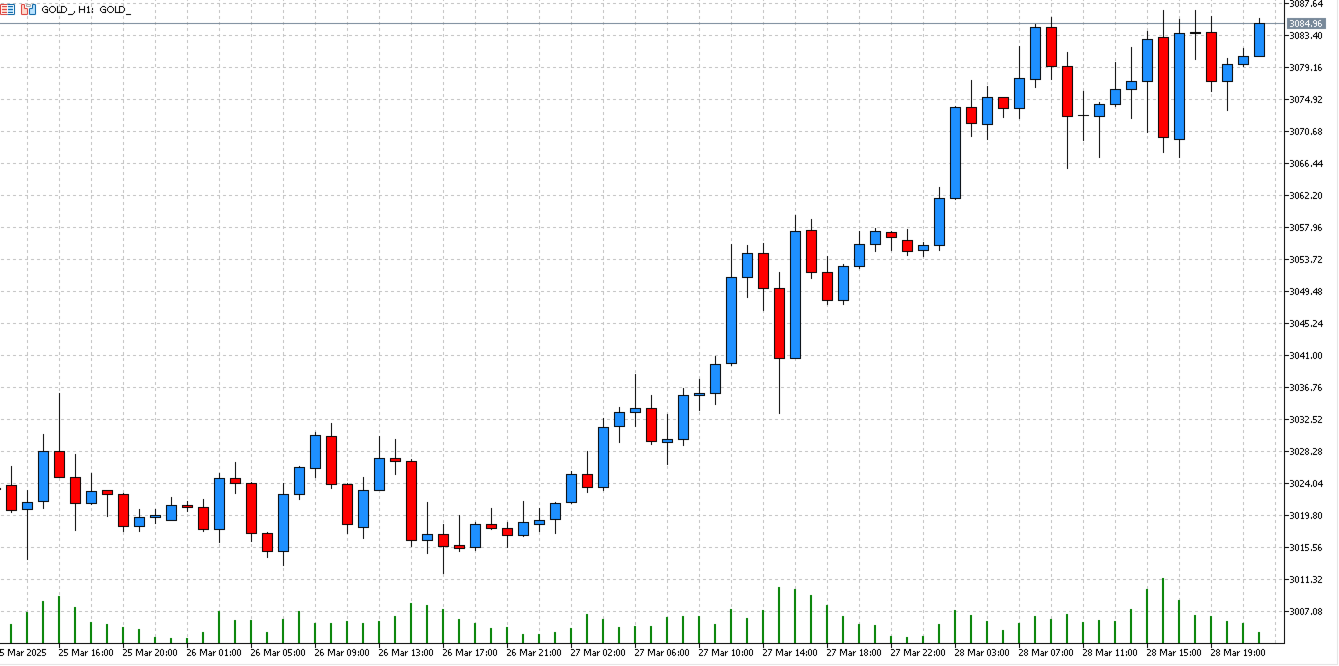
-Chart Visualization:
-Green lines represent uptrends
-Red lines represent downtrends
-Gray lines represent sideways movements
-Labels show trend number and wave size
-Experts Log:
-Check the"Experts"tab for detailed statistics and information
-Summary statistics are provided for each analyzed symbol
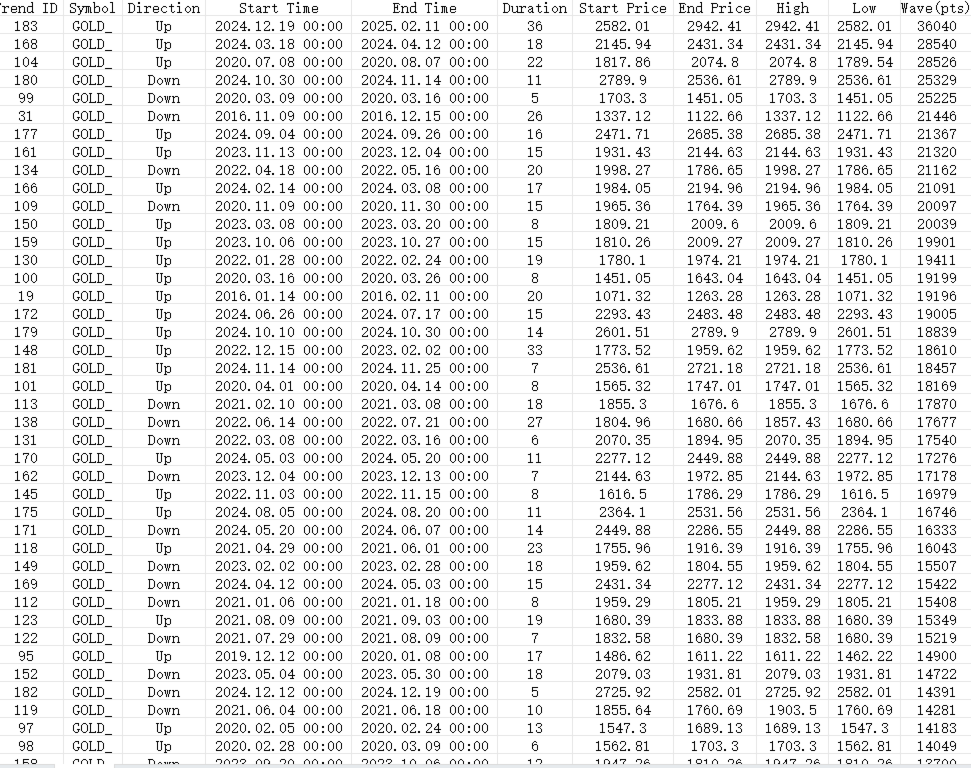
-CSV Export:
-Find the CSV file in the MQL5/Files directory
-The file contains detailed data about each identified trend
-Can be imported into Excel or other analysis software
Advanced Usage
-For more accurate trend identification,adjust the trend strength threshold(0.5-1.0)
-Increase minimum trend length for detecting only major trends
-Use time filters to focus analysis on specific trading sessions
-Compare results across different timeframes to identify multi-timeframe patterns