Tick Flow MT4
- Göstergeler
- Konstantin Chechnev
- Sürüm: 1.1
- Etkinleştirmeler: 5
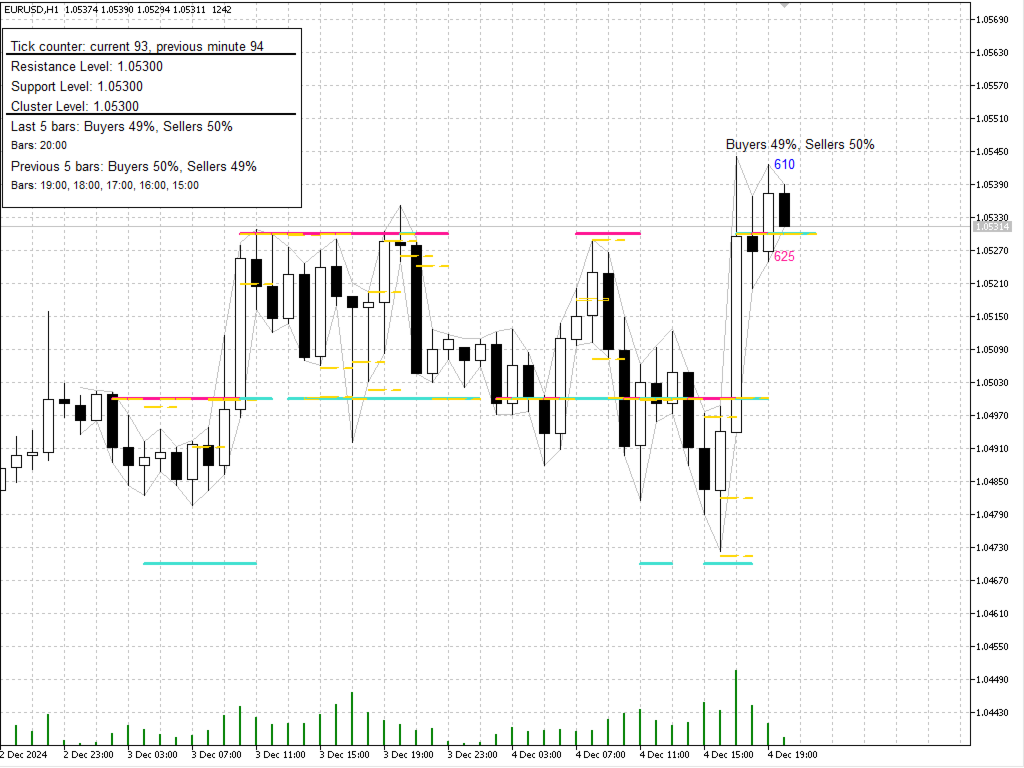
A powerful high-frequency tick analysis tool that automatically processes vast streams of market data and provides traders with an accurate picture of market activity to seize trading opportunities. Easily adaptable to any trading style, TickFlow becomes your personal analytical assistant, instantly responding to market changes and helping to identify key support, resistance, and cluster zones.
TickFlow is a modern analytical platform that combines intelligent big data processing with intuitive visualization. The indicator reveals hidden trends and price dynamics, offering flexible settings for quick adaptation to your strategies. By carefully aggregating current and historical tick data, it timely identifies significant market zones. TickFlow can serve as both a standalone analysis tool and a complement to your methods, providing a deep insight into market microstructure.
What TickFlow Offers You:
- Convenient display of price dynamics.
- Understanding of the balance between supply and demand.
- Rapid adaptation to market volatility.
- Unique analysis of significant zones of market interest.
- Access to historical data for hypothesis testing.
- Dynamic visualization of current levels without noise.
- Universal settings for any instrument and timeframe.
- Accelerated display of levels without repainting, cancellation, or delays.
TickFlow is a valuable tool for understanding the impact of tick data on price movements and dynamically determining support and resistance levels. It uncovers the connection between market microstructure and macro-level trends, providing instant visualization of market activity. Unlike static levels, TickFlow dynamically adapts to current conditions, displaying only significant zones while filtering out noise. By transforming the chaos of tick streams into a clear picture, the indicator gives you a competitive edge, helping you spot trends that may be missed by competitors with overloaded systems.
How to Adapt:
For scalping, more sensitive settings are suitable, such as a smaller number of bars for analysis, while broader ranges are optimal for intraday and medium-term trading. This allows you to tailor the tool to your style, and below you will find a detailed description to account for all nuances.
The smaller the analyzed timeframe, the more volatile the price movements become, which even major analytical agencies and banks cannot assess with high accuracy despite their powerful tools and teams of experienced analysts. It’s important to understand that technical analysis in isolation from fundamentals is a game of probabilities. However, proper risk management and a strategy that accounts for the balance of market forces and key factors can significantly increase your chances of success, turning probabilities in your favor. TickFlow helps develop professional analytical skills by providing data for independent decision-making, which, in the long term, enhances your ability to identify optimal trading moments without relying on automated signals.
Tick Analysis Settings
- Number of bars for analysis - Determines how many recent candles to analyze for calculating buyer and seller activity. For example, 5 means the last 5 candles.
- Setting: More bars = broader analysis, fewer bars = focused approach.
- Color of the UP tick counter - Sets the text color for the number of upward ticks (price increase) above the candle.
- Setting: Highlights price increases for quick tracking.
- Color of the DOWN tick counter - Sets the text color for the number of downward ticks (price decrease) below the candle.
- Setting: Highlights price decreases for easy analysis.
- Color of the buyers/sellers ratio counter - Specifies the text color for the percentage ratio of buyer and seller activity.
- Setting: Helps quickly assess the balance of forces in the market.
- Show tick activity history - Decides whether to display tick activity for past candles. If false (default), only the current candle is shown; if true, history is enabled. To avoid text overlap, use maximum chart scaling in the terminal.
- Number of bars to display - Indicates how many past candles to show with preserved tick history if history is enabled.
Support and Resistance Level Settings
- Number of ticks to analyze - Sets the volume of ticks to determine support and resistance levels. A smaller step = detailed levels, a larger step = general zones.
- For scalping: 5000–10000
- For intraday trading: 10000–20000
- For medium-term trading: 20000–50000
- Price step analysis - Determines the minimum price step for analysis. A smaller step = detailed levels, a larger step = general zones.
- Example for EURUSD, 5 decimals:
- For scalping: 0.0002–0.0005
- For intraday trading: 0.001–0.005
- For medium-term trading: 0.005–0.01
- Example for EURUSD, 5 decimals:
- Use clustering - Enables or disables cluster analysis—zones with significant struggle between buyers and sellers for a level.
- Price step for cluster activity evaluation - Price interval for grouping into clusters. For example, 0.001.
- Example for EURUSD, 5 decimals:
- For scalping: 0.0005–0.001
- For intraday trading: 0.001–0.01
- For medium-term trading: 0.01–0.03
- Example for EURUSD, 5 decimals:
- Number of historical levels to display - Sets how many previous support and resistance levels will be shown on the chart.
- Enable alerts for signals - Enables sound or text notifications when the price reaches current support, resistance, or cluster levels.
- Alert price distance - Sets the allowable distance (in price units) from a level at which a notification is triggered.
- Example for EURUSD (5 decimals): 0.0001–0.0002 (1-2 pips).