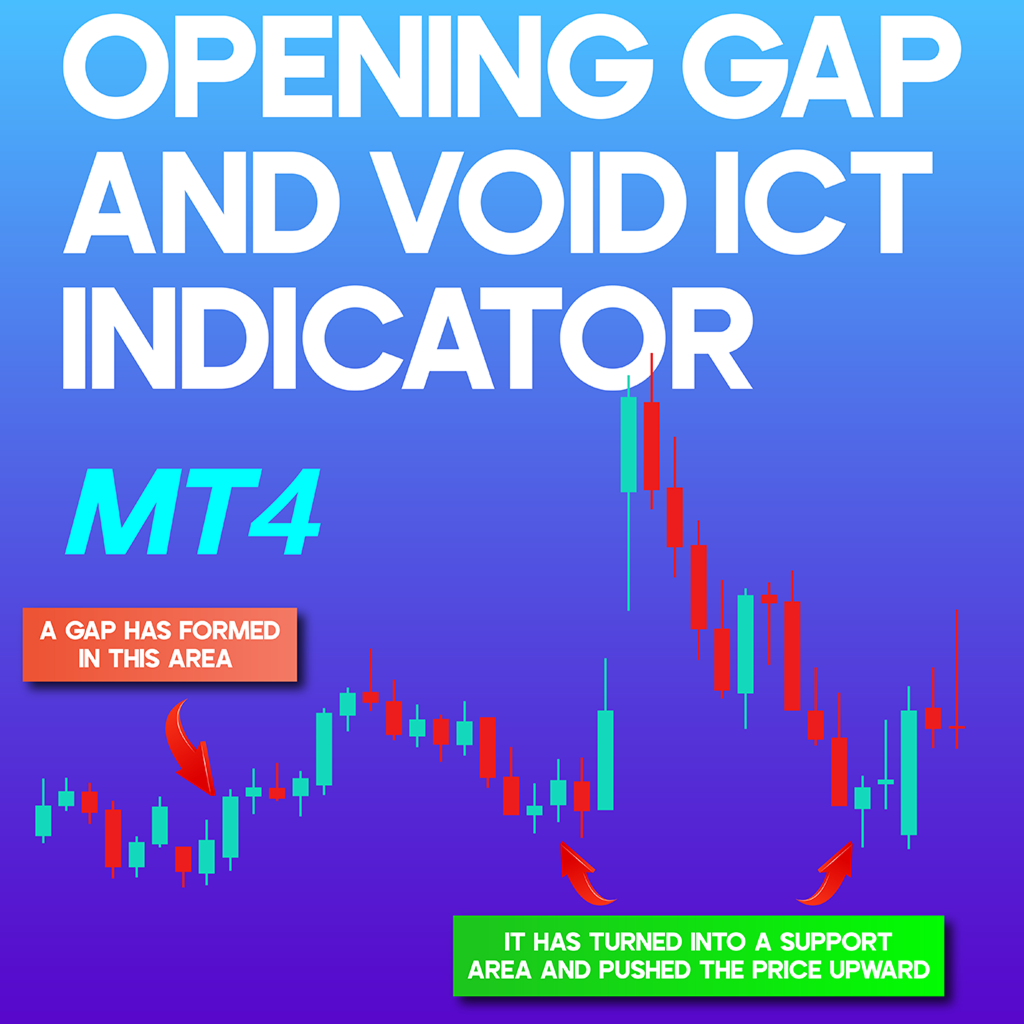
Opening Gap and Void ICT Indicator MT4
- Göstergeler
- Eda Kaya
- Sürüm: 1.11
Opening Gap and Void ICT Indicator MT4
The Opening Gap and Void ICT Indicator MT4 for MetaTrader 4 is specifically developed to identify price gaps that occur between trading sessions. A gap forms when a candlestick’s opening price significantly differs from the prior candlestick’s closing price.
This indicator automatically marks these price gaps on the chart. Once the market fills a gap, the indicator removes it, ensuring only unfilled zones remain highlighted.
«Indicator Installation & User Guide»
MT4 Indicator Installation | Opening Gap and Void ICT Indicator MT | ALL Products By TradingFinderLab | Best MT4 Indicator: Refined Order Block Indicator for MT4 | Best MT4 Utility: Trade Assistant Expert TF MT4 | TP & SL Tool: Risk Reward Ratio Calculator RRR MT4 | Money Management: Easy Trade Manager MT4
Indicator Specifications Table
Below is a summary of the specifications for the Opening Gap and Void ICT Indicator MT4:
| Category | ICT - Liquidity - Smart Money |
| Platform | MetaTrader 4 |
| Skill Level | Intermediate |
| Indicator Type | Continuation - Reversal |
| Timeframe | Multi-Timeframe |
| Trading Style | Intraday Trading |
| Market | Forex - Cryptocurrency - Stocks - Commodities |
Overview of the Indicator
Price gaps between candlesticks indicate a sudden shift in market conditions. This indicator highlights gaps caused by high volatility, major economic news, or shifts in market sentiment. By identifying these gaps, traders gain insights into potential price movements.
Initially, an unfilled gap is marked in green. Once the price revisits and fills the gap, it changes to red, indicating the area has been consumed.
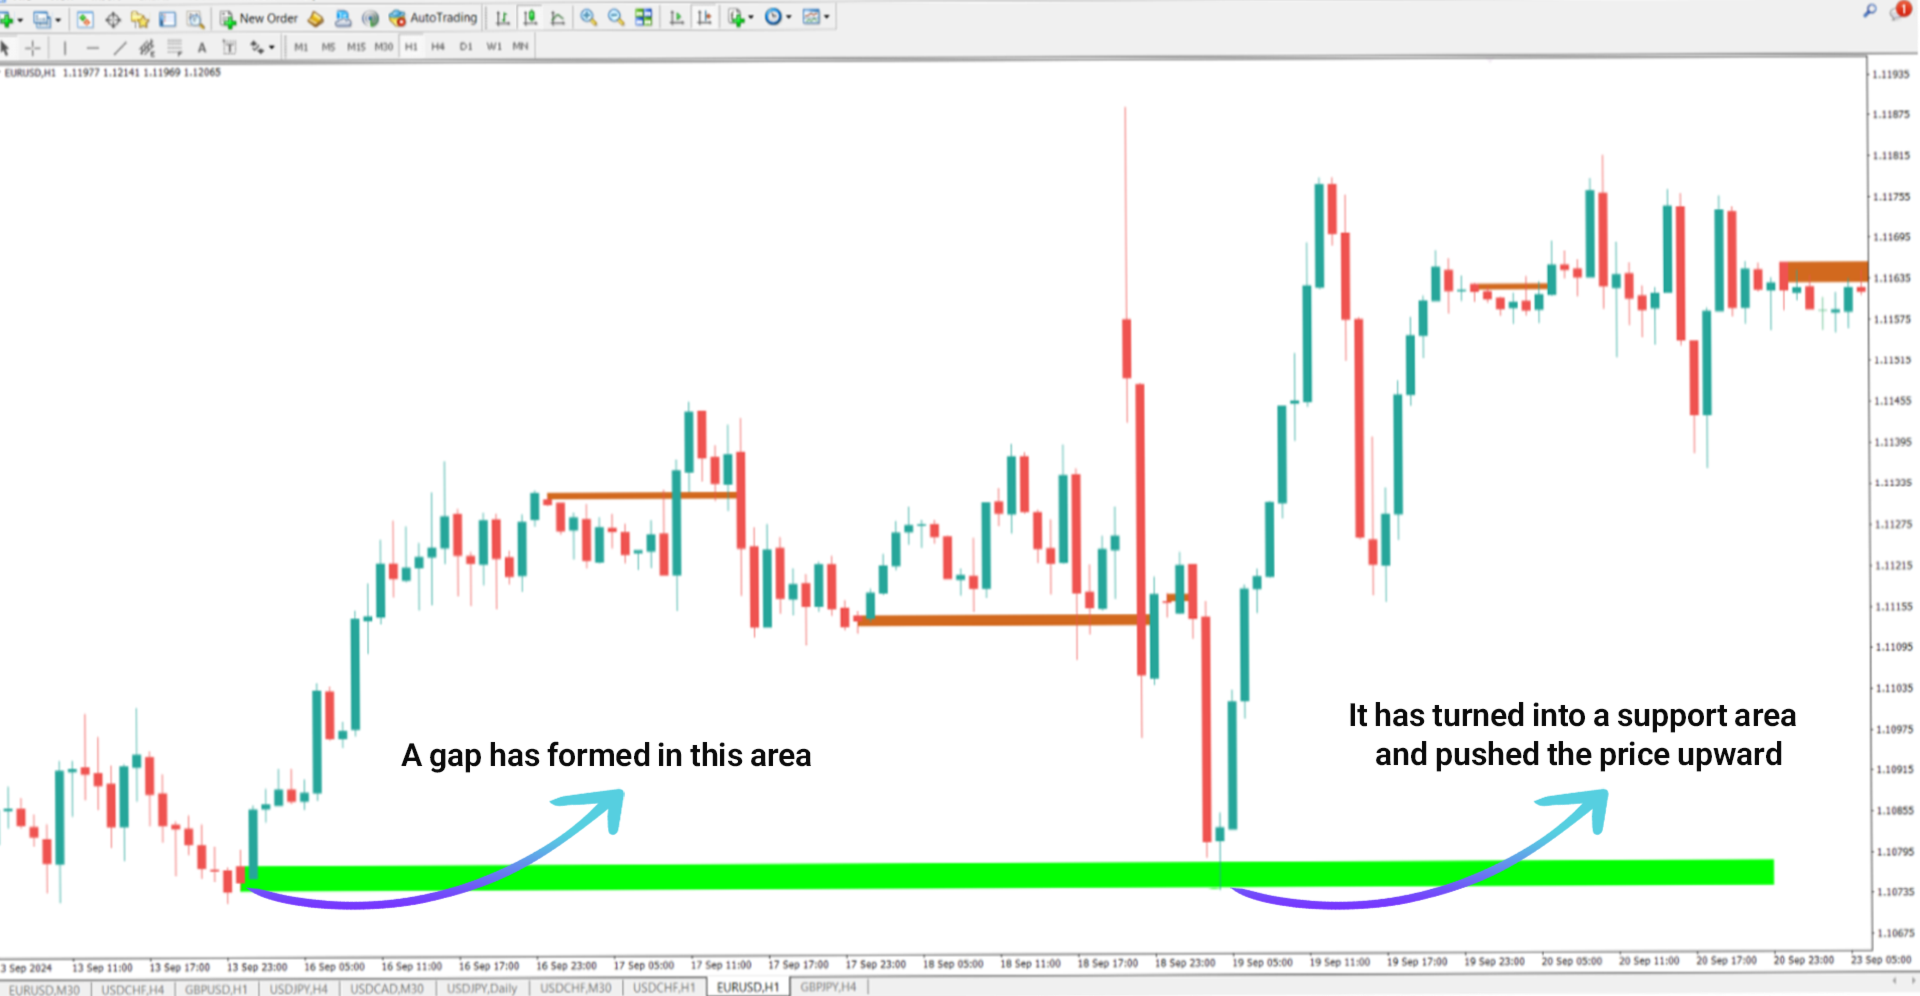
Opening Gap and Void ICT Indicator in an Uptrend
In an uptrend, price gaps can act as dynamic support zones. The EUR/USD 1-hour chart below illustrates how a gap formation precedes a price rally. These unfilled gaps serve as support, preventing deeper pullbacks when price retraces.
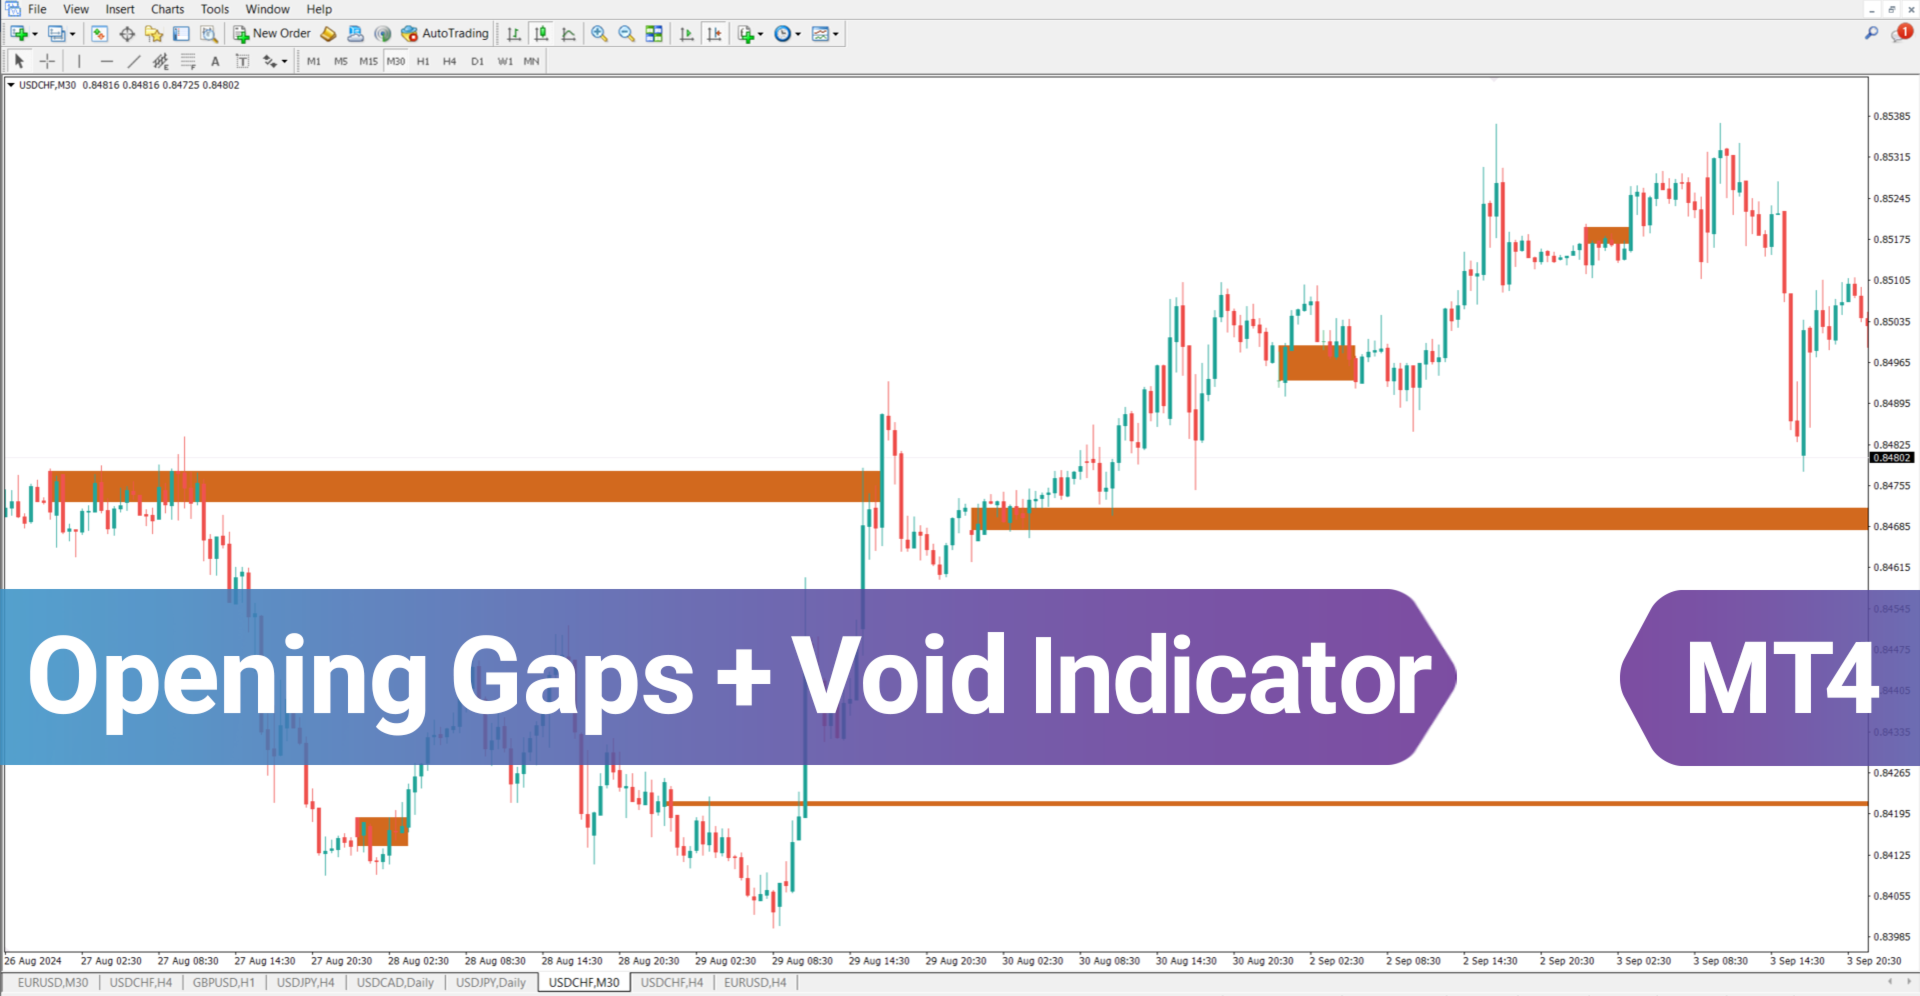
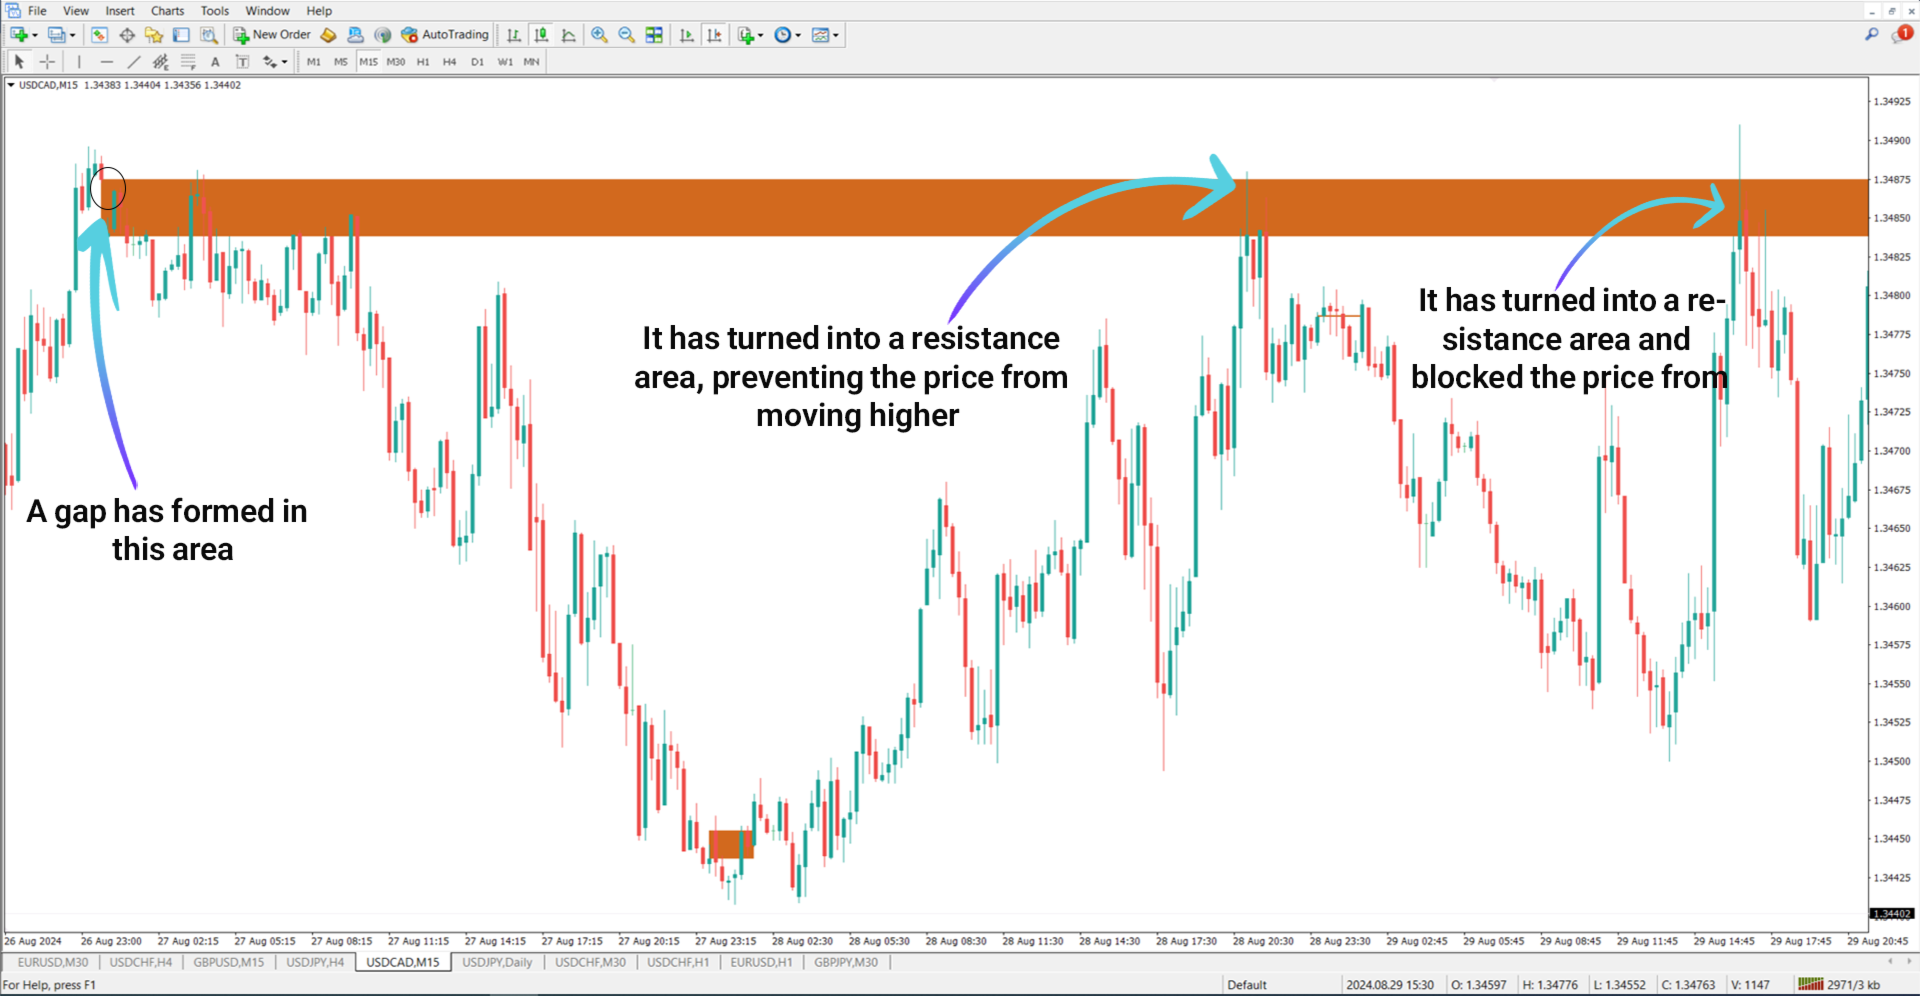
Opening Gap and Void ICT Indicator in a Downtrend
Conversely, in a downtrend, gaps function as resistance zones. The USD/CAD 15-minute chart below demonstrates how, upon reaching a resistance gap, the price reacts and moves lower.
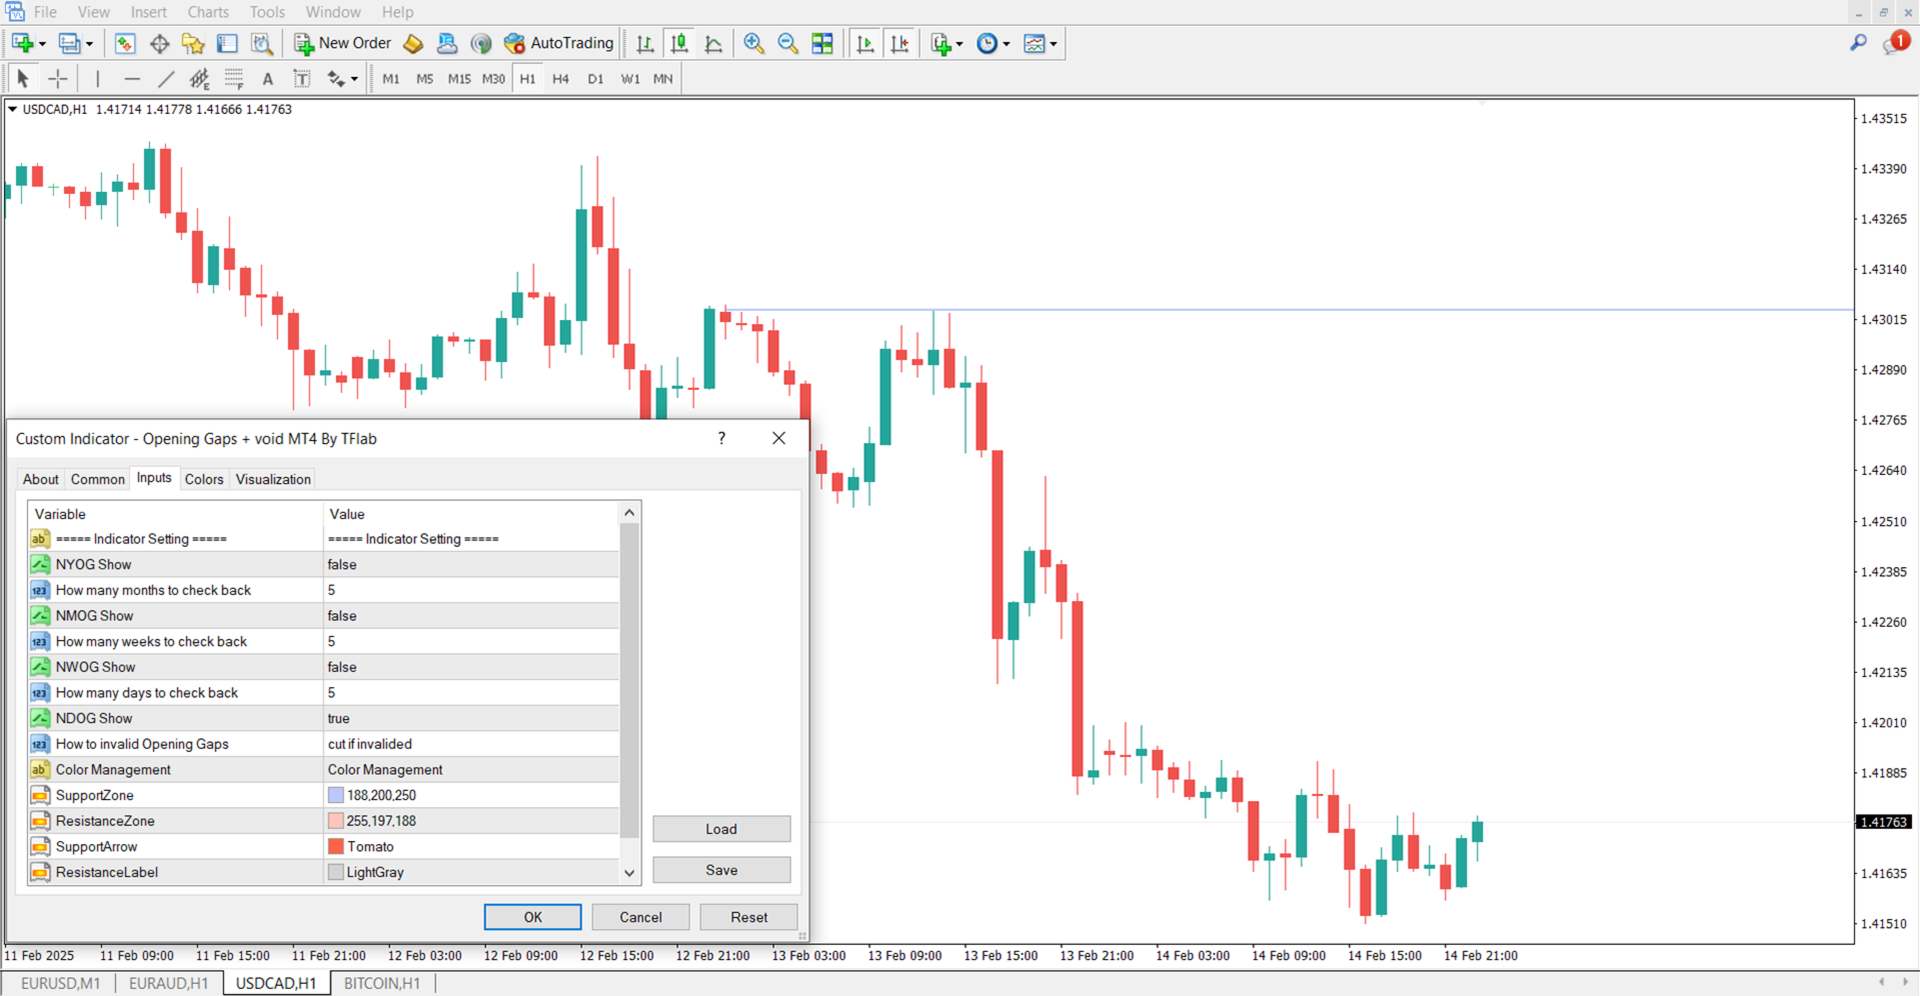
Opening Gap and Void ICT Indicator Settings
The following settings allow traders to customize the behavior of the Opening Gap and Void ICT Indicator MT4:
- HYOG Show – Enables annual gap detection
- Months to Check Back – Defines historical range for monthly gap analysis
- NMOG Show – Toggles monthly gap visibility
- Weeks to Check Back – Sets the timeframe for weekly gaps
- NWOG Show – Displays weekly gaps on the chart
- Days to Check Back – Determines the tracking period for daily gaps
- NDOG Show – Activates daily gap identification
- Invalidate Gaps – Defines conditions under which gaps should be removed
- SupportZone – Customizable color for support gap areas
- ResistanceZone – Customizable color for resistance gaps
- SupportArrow – Adjusts the arrow color for support signals
- ResistanceLabel – Modifies the label color for resistance zones
Conclusion
The Opening Gap and Void ICT Indicator MT4 is a powerful tool for identifying price gaps in financial markets. These gaps often act as critical support and resistance zones, helping traders refine their market analysis.
Traders utilizing ICT methodologies, Smart Money principles, and liquidity-based strategies can leverage this indicator to enhance trade execution and overall decision-making.