XAMD or AMDX Indicator ICT MT5
- Göstergeler
- Eda Kaya
- Sürüm: 1.11
XAMD/AMDX Indicator ICT MT5
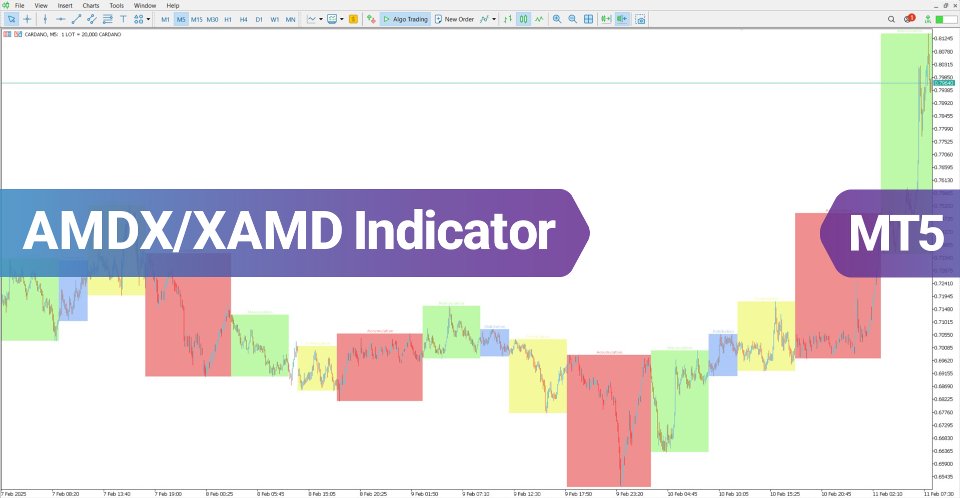
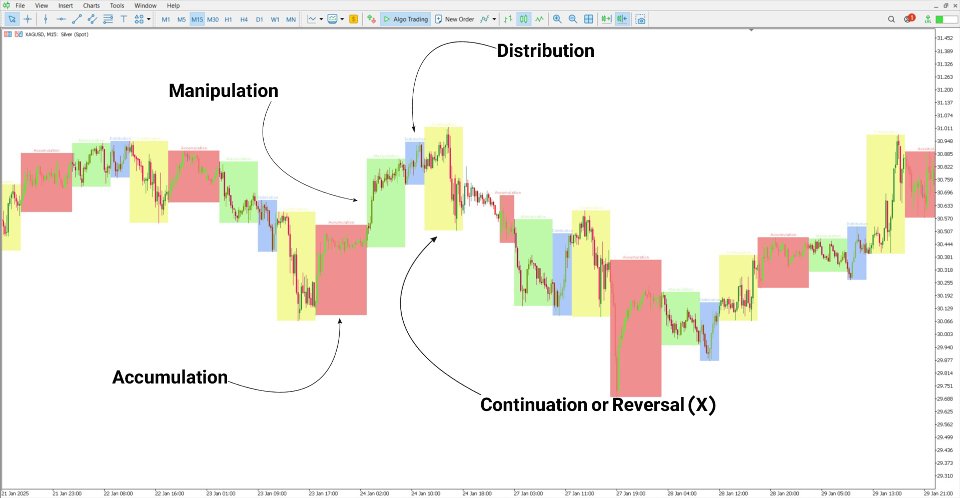
The XAMD/AMDX Indicator, built upon the ICT trading framework, assists traders in recognizing potential trend shifts within the market. This liquidity-based tool for MetaTrader 5 organizes price action into three primary stages: Accumulation, Manipulation, and Distribution, which are visually marked using distinct color-coded boxes.
A fourth stage, Continuation or Reversal (X), distinguishes the XAMD/AMDX Cycle Indicator from the standard AMD ICT Indicator on the MetaTrader 5 platform, adding an extra layer of market insight.
Indicator Specifications Table
The table below outlines the specifications of the XAMD/AMDX Cycle Indicator:
| Category | ICT - Smart Money - Liquidity |
| Platform | MetaTrader 5 |
| Skill Level | Advanced |
| Indicator Type | Continuation - Reversal |
| Timeframe | Multi Timeframe |
| Trading Style | Scalping - Intraday Trading |
| Market | Crypto - Forex - Stocks - Commodities |
Indicator at a Glance
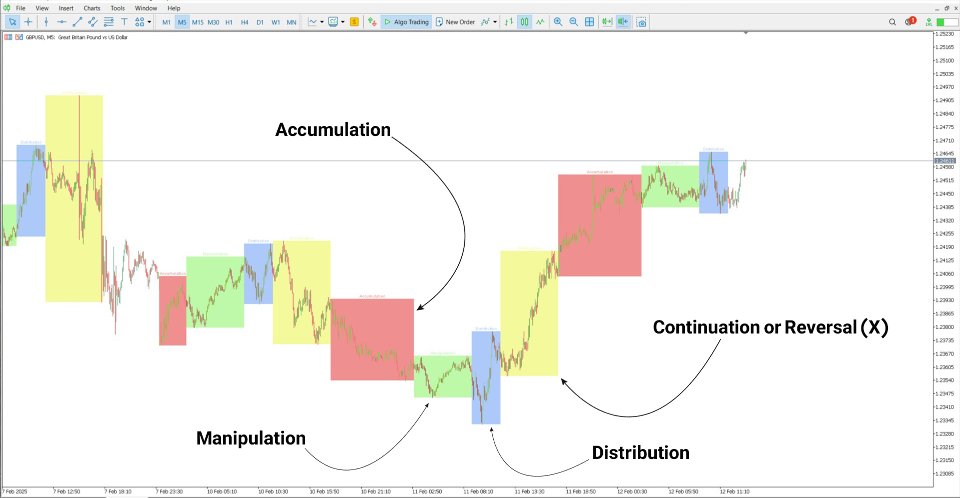
The XAMD/AMDX Cycle Indicator highlights the Continuation or Reversal (X) phase using a yellow box. This specific phase may emerge at either the start or conclusion of a market cycle. Depending on prevailing price action, this stage can indicate a trend continuation or an impending reversal. The interpretation of this zone varies based on market dynamics, making it a crucial element of ICT-based trading strategies.
Uptrend Example
On a 5-minute GBP/USD chart, the Accumulation and Manipulation stages typically push prices downward toward lower price levels. Following this, the Distribution phase propels prices upward, while the X phase continues this movement.
The illustration below demonstrates how the X phase appears at the conclusion of other phases, reinforcing the AMDX structure in an uptrend.
Downtrend Example
An analysis of a 15-minute XAG/USD chart reveals that prices rise during the Manipulation (green box) and Distribution (blue box) phases. As shown in the example, the X phase serves as a strong reversal signal, confirming its importance in identifying key turning points in a downtrend.
XAMD/AMDX Indicator Settings
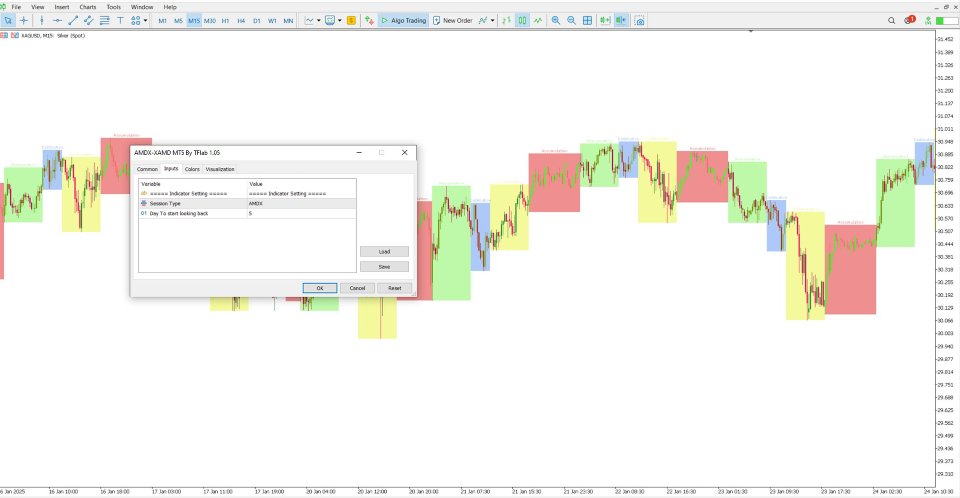
The settings for the XAMD/AMDX Indicator are categorized into two main sections:
- Session Type: Select between "XAMD" and "AMDX" options
- Days to Start Looking Back: Specify the number of days to calculate historical data
Conclusion
The XAMD/AMDX Cycle Indicator is an ICT-based trading tool designed for MetaTrader 5, offering a structured approach to market analysis. By segmenting price action into clearly defined color-coded zones, it enhances traders' ability to anticipate market movements.
This indicator features three core phases: Accumulation (Red Zone), Distribution (Blue Zone), and Manipulation (Green Zone). Unlike the standard AMD ICT Indicator, this tool integrates an additional phase—Continuation or Reversal (X)—which provides deeper insights into potential trend shifts.
