• Genel bakış
  • İncelemeler
  • Yorumlar (4)
  • Yenilikler

TrueTrendStarM TTSm25

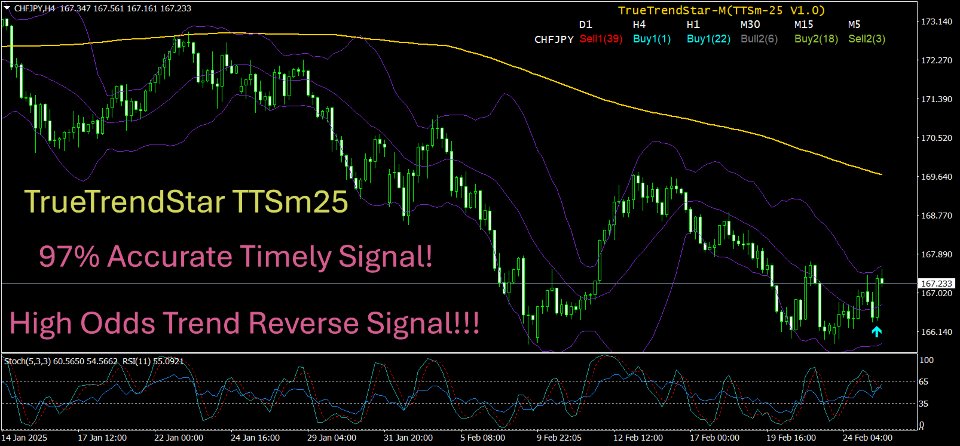
   This is a mini version(One pair) of Advanced Detector of Trend Reversal and Continuance known as TrueTrendStarM(TTSm25). It is a sensitive and Predictive indicator of Price Trends for Professional traders.

(WEEKEND DISCOUNT ON 10% !!)( ATTENTION BUYERS:-PLEASE CONTACT SELLER FOR HOW BEST TO USE THE INDICATOR FOR MAXIMUM PROFITS )

   It detects high odds changes in Price Trend direction long before other indicator detects it. I have been working on it since 2019.

   This is possible due to fractal nature of forex and other financial markets,which this indicator captures it consistently. It can generate Signals for all types of markets viz currency,crypto,metals,energy,Stock etc

   It used an accurate non-repainting custom indicator that scans the single selected currency pair 24hrs in all time-frames and captures the currency pair Trend status in an elegant Dashboard. It also display arrows where the signal occurred for timely and pinpoint entry.

   How will TTS indicator Show Changes in Trend?

   TTS will show When:

  • Uptrend is starting
  • Uptrend is getting weaker
  • DownTrend is starting
  • Downtrend is getting weaker. 

   The indicator signal is non-repainting and high probability and can be used effectively by any traders including Propriety firms.

   One important thing the Trader will notice is the almost immediate movement of price towards the direction of the TTS signal because of its  high probability nature.

   TTS indicator important features

  •  High Probability Trade Signals 
  •  Predicts Trend Direction
  •  Indicate Price Turning Points & Reversals
  •  Indicate Price Trend Continuance Points
  •  Capture short term & long term price action
  •  Indicate Trend Strength & Acceleration
  •  Indicate Signal Freshness
  •  Creates dynamic Support & Resistance levels at Signal points
  •  Comprehensive Market analysis tool
  •  Signals across Multi-timeframes(max 6 at a time)
  •  Analyse single selected pair
  •  Alert all Signals
   Why TTS indicator is for you?

       TTS is an indicator i personally use for manual & semi-Automatic trading with good and consistent results since 2021 before releasing to the public.

          I will like to welcome you to try out the high odds entry signal of TTS Indicator by Renting for 1month and by following  the Proven Strategy as given below, freely given, to help you out in your trading. Demo version is available but has inherent limitations by default, however you can familiarize with the indicator by testing the demo in strategy tester and see how Signals update in various timeframes.Almost all signals are High Odds esp in higher timeframe and TTS indicator Win Rate > 97%

          Before loading the indicator Dashboard into a chart,make a Blank template without any indicators although not mandatory.Then the TTS indicator will  load onto the chart without any problems.The background color as well as colors of Signals etc are completely user customizable.

          Customization and Settings

        TTS allows traders to adjust key settings to match their trading style:

      • Custom Signal Colors: Modify the colors of Buy1, Buy2, Sell1, Sell2,Bull1, Bull2, Sell1 and Sell2 signal for better visibility.Also option given to customise color of header Row and Column.
      • Selectable Forex Pairs: Focus on specific currency pair that match your strategy
      • Timeframe Selection: Customize which timeframes(max 6) are displayed on the dashboard for easier monitoring, default as D1,H4,H1,M30,M15,M5 where each timeframe header is separated by comma.
      • Alert System: Set up notifications viz PopUp, Email and Push, when new signals appear to avoid missing trade opportunities.Alert time interval can also be adjusted for convenience.(default at 3 times per timeframe)
        How TrueTrendStar Signal Works ?

        TTS continuously evaluates price behavior and market momentum to determine when trends are forming or reversing. It classifies signals into eight key types:

      • Buy1 Signal: The first sign of an emerging  high odds uptrend. This appears when market conditions indicate a shift toward bullish momentum.
      • Buy2 Signal: A high odds uptrend signal after Accumulation Extension, Deep Correction or First Correction after Double Bottom/Top reinforcing   the likelihood  of continued price increase. This signal has strong Recoil energy.
      • Sell1 Signal: The first indication of a high odds downtrend, appearing when bearish conditions develop.
      • Sell2 Signal: A high odds Dntrend signal after Distribution Extension, Deep Correction or First Correction after Double Bottom/Top reinforcing the likelihood  of continued price decrease. This signal has strong Recoil energy.
      • Bull1 Signal:  Bullish Correction/Reversal signal ensured by confirmations. Often Signals start of Double Top too.
      • Bull2 Signal:  Bullish signal.(less bar nos the better)
      • Bear1 Signal: Bearish Correction/Reversal signal ensured by confirmations  Often Signals start of Double Bottom too.
      • Bear2 Signal: Bearish signal.( less bar nos the better )
      • Buy1, Sell1:   Normal Buy and Sell signals respectively.
      • Buy2, Sell2:   Somewhat Abnormal Buy and Sell signals respectively
      • Buy1 generally indicates start of

                                        Inverse head and shoulder formations(Inv H&S) or
                                        Double bottom(DB) or 
                                        Upswing(US)

               which are all high probability patterns. 

      • Sell1 generally indicates start of

                                       Head and Shoulder formation(H&S) or
                                       Double Top(DT) or
                                       DownSwing(DS)

               which are all high probability patterns.

      • Buy2 generally indicates start of

                                       Correction after Deep Accumulation Extension or
                                       Abnormal Double bottom(DB) or 
                                       Upswing(US) to rejoin Uptrend

               which are all high probability patterns . 

      • Sell2 generally indicates start of

                                        Correction after Deep Accumulation Distribution or
                                        Abnormal Double Top(DT) or 
                                        DnSwing(DS) to rejoin Dntrend

               which are all high probability patterns . 

      • When Conflicting Signals occurs across timeframes,generally Higher timeframes signal prevails
      • Uniformity of signals in adjacent timeframes are significant 
      • Shows the changes in price is sometimes from low timeframe to high timeframe or vice versa

      • Dashboard Signal in forex pair is significant to its Correlated pairs too and can be inspected for concurrence.

      • The Dashboard signal can be used as standalone signal however it may be complemented by compatible indicators like Bollinger band,Wave count indicators,Double Bottom or Top indicator,Oscillators like RSI & Stochastic and 200 periods Simple Moving Average.

      • The TTS indicator can be used on any time intervals on the chart, ranging from minute (M1) to monthly (MN).

      • Following these signals upto its Trend-End  Zone can reap consistent pips.

      • Signals in Compatible time-frame can be more powerful confirmation of Trend Directions,Its Changes or Continuations.For example M5-M30,M30-H4 are Compatible time-frames

      • Clicking on Signal Label will open up the forex pair chart of the particular time-frame where one can trade the signal immediately.

      • Using the TTS Dashboard indicator's signals, precise entry points is indicated, with an average risk-to-reward ratio exceeding 1:2. 

      • Occurence of Trend Change signal after sufficient trending or consolidation of prices is most probable for trend change .


         Step-by-step video instructions explain how to work with the indicator using specific examples, even if you're doing it for the first time.

         Each of these signals is carefully calculated using advanced algorithms that consider price action, volatility, and momentum.

           Multi-Timeframe Market Scanning

         One of TTS’s standout features is its ability to analyze multiple timeframes simultaneously. Instead of focusing on a single timeframe, traders can view trend signals across various time horizons, gaining a broader perspective of market conditions.

        This multi-timeframe approach allows traders to:
           ✅ Identify long-term trend direction while executing trades on shorter timeframes.
           ✅ Avoid false signals by ensuring trends align across multiple timeframes.
           ✅ Spot high-probability trade setups where short-term and long-term trends match.

        TTS displays this information on an intuitive dashboard, making it easy to check trend signals for different timeframes at a glance.

        How to Use TTS Effectively    Trade Execution Strategy
      • Compatible Timeframe Signals Trend(CTST) strategy-For Example-EURUSD shows Sell2 signal in H4 timeframe,Wait for Sell1 or Sell2 in M30 to open Sell trade.Close the trade when Buy1 or Buy2 shows up in M30min.Early exit can be done on Buy1 or Buy2 signals in 5min timeframe too.Similarly for the Buy signals also.
      • Main Trend Direction Scalping(MTDS) strategy-For example-GBPUSD show Buy1 or Buy2 signals in H4 timeframe,wait for Buy1 or Buy2 in 5min timeframe to open Buy trades.Close the trades when Sell1 or Sell 2 happens in 5min timeframe.
      • Positional Trend(PT) strategy-For example-USDCAD shows Buy2 signal in H4 timeframe,then immediately enter Buy trade and wait for Sell1 or Sell2 signals in H4 to close the trades.For early exit,open trades can be exited when Sell1 or Sell2 signals happen in nearest lower timeframe i.e H1.
      • Low to High Swing Reversal(LTHS) strategy-For example-USDCHF shows Buy2 signal in H4 timeframe and Sell2 signal in 5min timeframe, then immediately enter sell trade trade and wait for Sell1 or Sell2 in nearest higher timeframe i.e 15min timeframe,and if happened,there is follow through and the trades can be hold longer as successful reversal trades.Trades can be closed if Buy1 or Buy2 happens in 5min timeframe thereafter.
      • Confirm Trend(CT) strategy-For example-EURUSD shows Bear2(1) signal in H4 timeframe,then immediately enter Buy trade,wait for Buy1 or Buy2 signals in next lower timeframe i.e H1 or M30,then close the trade.
      • Buy and Hold(BH) strategy-For example-USDJPY shows Buy2 signal in H4 timeframe,then wait for Buy1 or Buy2 signals in H1/M30/M15 timeframes and add more Buy positions whenever signals happen in compatible lower timeframes.Trades can be exited when Sell1 or Sell2 signal happen in H4 timeframe.
      • Entry on TTS Signal and Exit on Other Indicators(ETEOI) strategy-For example-USDJPY shows Buy1 in M30 timeframe,then enter Buy trade and Exit on Rsi or Stochastic Overbought signal in same timeframe.

          The above given trading strategies are tested and proven as reliably consistent.However, the TTS signals can also be used along with compatible indicators such as Bollinger Bands,Wave Count,Double Bottom and Top indicator,Oscillators like RSI/Stochastic and 200 period simple moving average.However,as explain above,the TTS signals alone is sufficient to trade the markets with high odds entries and exits.

        Customization and Settings

        TrueTrendStar allows traders to adjust key settings to match their trading style:

      • Custom Signal Colors: Modify the colors of Buy1, Buy2, Sell1, and Sell2 signals for better visibility.
      • Selectable Forex Pairs: Focus on a specific currency pair that match your strategy.
      • Timeframe Selection: Customize which timeframes are displayed on the dashboard for easier monitoring(max 6).
      • Alert System: Set up notifications when new signals appear to avoid missing trade opportunities.
        Why Choose TrueTrendStar?

           ✅ Non-Repainting Signals: Once a signal is generated, it remains fixed, ensuring transparency and accuracy.
           ✅ Multi-Timeframe Analysis: See trend shifts across multiple timeframes for better decision-making.
           ✅ Early Trend Detection: Get ahead of the market by identifying high odds reversals before traditional indicators.
           ✅ User-Friendly Dashboard: Quickly assess market conditions without needing complex analysis.
           ✅ Versatile Trading Application: Suitable for Scalping, Day trading, Positional trading , Swing trading and Buy & Hold trading.


        What this means for you?

        TrueTrendStar is a powerful and reliable forex trading indicator designed to help traders identify trend changes early and trade with confidence. Its a combination of non-repainting trend signals, multi-timeframe analysis, and an intuitive dashboard which makes it a must-have tool for both beginner and experienced traders to trade currencies professionally and profitably.

        By integrating TTS into your trading strategy, you can improve market timing, minimize guesswork, and enhance your overall trading performance.

        (In case of any doubt about the indicator or strategy,a buyer can contact the author through the messaging system of MQL5.Com site.)


        Warm regards for your profitable trading success!

        Note:: By design, The TTS indicator update after every time interval of 10sec.


      Önerilen ürünler
      Heiken Ashi candle chart is an improved version of The Japanese candle chart, which can effectively filter the market "noise" of the Japanese candle chart. It is favored by many traders for its simplicity and intuition. For trend traders, the HA candle chart is a magic tool. Unlike the traditional Japanese candle chart, Heikenashi does not reflect the opening price, high price, low price and closing price of the market. Instead, Heikenashi calculates the value of a single K line in the dominant
      This indicator works on MT4 and is very easy to use. When you receive a signal from it, you wait for that candle with the signal to close and you enter your trade at the beginning of the next new candle . A red arrow means sell and a green arrow means buy. All arrows comes with Alert  like for easy identification of trade signal. Are you okay with that? 1 minute candle 1 minute expire
      This is an arrow indicator without a future function,developed based on the most advanced profit trading algorithms.It has the most innovative and advanced dual trend analysis module, as well as the latest and highly effective market trend prediction algorithm.Trends are your friends, and following larger trends can earn the maximum profit in foreign exchange. This indicator helps traders identify current trends and track them. Someone once made a profit of 10 times in a week by relying on it.No
      Intraday Levels shows intraday levels grid for intraday trading Shows a grid for the day levels, gives you a guide to know the trend and to measure intraday trades (stop-loss and take-profit). Parameters are: Levels Mode: Basic mode: Shows highest, lowest and middle levels. Advanced mode: Shows highest, lowest, middle and intermediate levels. Fibonacci mode: Shows session Fibonacci retracements levels. Momentum mode: Shows delayed Advanced levels to identify momentum. Smooth Period (Momentum m
      Be notified of every color change of Heiken Ashi (HA) candles. The indicator will trigger past and new signals every time that HA candles change their colors. Note : this tool is based on the code of Heiken Ashi indicator developed by MetaQuotes Software Corp. Features The signals are triggered at closing of last bar/opening of a new bar; Any kind of alerts can be enabled: Dialog Box, Email message, SMS notifications for smartphones and tablets, and Sound alerts; By default, up arrows are plott
      Are you tired of drawing trendlines every time you're analyzing charts? Or perhaps you would like more consistency in your technical analysis. Then this is for you. This indicator will draw trend lines automatically when dropped on a chart. How it works Works similar to standard deviation channel found on mt4 and mt5. It has 2 parameters: 1. Starting Bar 2. Number of bars for calculation The   starting bar   is the bar which drawing of the trend lines will begin, while the   number of bars for c
      FREE
      Trend Bilio - an arrow indicator without redrawing shows potential market entry points in the form of arrows of the corresponding color: upward red arrows suggest opening a buy, green down arrows - selling. The entrance is supposed to be at the next bar after the pointer. The arrow indicator Trend Bilio visually "unloads" the price chart and saves time for analysis: no signal - no deal, if an opposite signal appears, then the current deal should be closed. It is Trend Bilio that is considered
      Magic Filter MTF is perfect for any strategy. you do not need to load the chart with extra indicators like this one indicator will replace all additional filters for you it can also be a great strategy. it combines well with trading at local minima and maximums (resistance levels) multi-timeframe-multi-currency indicator 4 screen system is used 4 rows of arrows UTB indicators adjusted for different periods when two arrows pointing in the same direction on the same timeframe coincide,I t c
      SCALP ARROW EXIT SIGNALS PLEASE REFER THE COMMENTS AREA - HOW THE SIGNALS CAN BE MADE BETTER QUALITY USING RENKO CHARTS  IF YOU REQUIRE THE RENKO CHARTS DO LET ME KNOW , WILL HELP Indicator is a professional tool for guiding reliable entries, exits, reentries, and RETRACEMENT entries and pull back entries. It is a complete blackbox system and can be used to get signals for any instrument and any time frame. The indicator generates signals, alerts - ENTRY -EXIT . Its can be used to scalp - med
      Introduction Take your forex trading to the next level with our vibrant, color-coded session indicator! Designed for MT4/MT5, this tool visually separates the Asian (Purple) , London (Yellow) , and NYC (Pink) trading sessions for optimal trading strategy. Key Features Color-Coded Precision : Asian (Purple), London (Yellow), NYC (Pink) sessions marked directly on your chart. Perfect for Session Traders : Focus on the overlaps and high-volatility periods. Compatibility : Works seamlessly with MT4
      Power Renko is an indicator which plots Renko bricks underneath the chart using a histogram. You can select the brick size and the timeframe of the Renko bricks as well as whether or not to use the close price or the high/low price of the candles. Renko bricks are based on price alone, not time, therefor the Renko bricks will not be aligned with the chart's time. They are extremely useful for trend trading and many different strategies can be formed from them. Buffers are provided allowing you t
      Introduction It is common practice for professional trades to hide their stop loss / take profit from their brokers. Either from keeping their strategy to the themselves or from the fear that their broker works against them. Using this indicator, the stop loss / take profit points will be drawn on the product chart using the bid price. So, you can see exactly when the price is hit and close it manually.  Usage Once attached to the chart, the indicator scans the open orders to attach lines for t
      Heikin Ashi Dashboard
      Taras Slobodyanik
      5 (5)
      Çoklu para birimi ve çoklu zaman çerçeveli Heikin Ashi göstergesi. Piyasanın mevcut durumunu gösterir. Tarayıcı panelinde mevcut trendin yönünü, gücünü ve çubuk sayısını görebilirsiniz. Konsolidasyon/Tersine Dönme mumları da renk kullanılarak gösterilir. Parametrelerde istediğiniz para birimini ve periyodu belirtebilirsiniz. Ayrıca gösterge, trend değiştiğinde veya tersine dönüş ve konsolidasyon mumları (dojiler) göründüğünde bildirim gönderebilir. Bir hücreye tıkladığınızda bu simge ve nokta a
      What are Heiken Ashi Candles? Heiken Ashi, derived from the Japanese term 'Heikin Ashi,' translates to average price bars. It's an indicator depicting price bars on a chart. Formula for Heiken Ashi candles: - Heiken Ashi opening price: (previous candle's opening + closing price) / 2 - Closing price Heiken Ashi: (opening + high + low + closing) / 4 - Heiken Ashi peak: Max of high, opening, or closing price - Heiken Ashi bottom price: Min of low, opening, or closing price How to Read Heiken A
      Advanced Trend Regime
      Shellard Securities (Pty) Ltd
      The indicator has been designed to function on any time-frame and any pair.   This regime filter will help the trader better evaluate whether the current market is trending, and in which direction. It quickly reacts to changes in market dynamics using a series of advanced calculations. The user is able to select whether the calculation remains standard, or if a further filter constraint is added to the calculation.   A Yellow moving average of the signal has been included for the trader to smoot
      Heiken Ashi Button
      Lee Teik Hong
      4.75 (4)
      Heiken Ashi Button Heiken-Ashi , often spelled Heikin-Ashi, is a Japanese word that means "Average Bar." The Heiken-Ashi approach can be used in conjunction with candlestick charts to spot market trends and forecast future prices. It's useful for making candlestick charts easier to read and analysing patterns. Traders can use Heiken-Ashi charts to determine when to stay in trades while the trend continues and close trades when the trend reverses. The majority of earnings are made when markets a
      FREE
      TrendPlus
      Sivakumar Subbaiya
      4.07 (14)
      Trend Plus   Trendplus  Indicator   Time Frame: Suitable for any time frame.  Purpose: Trend Prediction. Blue and red candle indicate the buy and sell call respectively. Buy: When the blue candle is formed buy call is initiated. close the buy trades when the next red candle will formed.   Sell: When the Red candle is formed Sell call is initiated. close the Sell trades when the next blue candle will formed.   Happy trade!!
      FREE
      Sayı dizilerinden birine "Orman Yangını Dizisi" denir. En güzel yeni dizilerden biri olarak kabul edildi. Başlıca özelliği, bu dizinin lineer trendlerden, hatta en kısa olanlardan kaçınmasıdır. Bu göstergenin temelini oluşturan bu özelliktir. Bir finansal zaman serisini analiz ederken, bu gösterge tüm olası trend seçeneklerini reddetmeye çalışır. Ve ancak başarısız olursa, bir trendin varlığını tanır ve uygun sinyali verir. Bu yaklaşım, yeni trendlerin başladığı anların doğru bir şekilde belirl
      Renko, Heiken Ashi, Ticks Bar, Range Bar.    Easy switching, easy setup, all in one window.        Place the Custom Chart indicator and view Renko, Heiken Ashi, Tick bar, Range bar charts in real time at real chart.    Position the offline chart window so that the indicator control panel is visible.    Switch the chart mode by click of a button.    Connect to the output chart any indicator, expert advisor without any restrictions.    No, it doesn't work in the tester.    Yes, you can use an
      Alpha Trend sign has been a very popular trading tool in our company for a long time. It can verify our trading system and clearly indicate trading signals, and the signals will not drift. Main functions: Based on the market display of active areas, indicators can be used to intuitively determine whether the current market trend belongs to a trend market or a volatile market. And enter the market according to the indicator arrows, with green arrows indicating buy and red arrows indicating se
      MASi Three Screens
      Aleksey Terentev
      5 (2)
      MASi Three Screens is based on the trading strategy by Dr. Alexander Elder. This indicator is a collection of algorithms. Algorithms are based on the analysis of charts of several timeframes. You can apply any of the provided algorithms. List of versions of algorithms:     ThreeScreens v1.0 - A simple implementation, with analysis of the MACD line;     ThreeScreens v1.1 - A simple implementation, with analysis of the MACD histogram;     ThreeScreens v1.2 - Combines the first two algorithms in
      FREE
      Heiken Ashi Smoothed Strategy is a very simple but powerful system to get forex market trend direction. This indicator is actually 2 indicators in 1 pack, Heiken Ashi and Heiken Ashi Smoothed Moving Average both included. Because HA (Heiken Ashi) and HAS (Heiken Ashi Smoothed) are calculated in the same one system event with necessary buffers and loop only, so it is the FAST, OPTIMIZED and EFFICIENT HA having the combined indicator of MetaTrader 4. You can choose to display HA and HAS in the sam
      To download MT5 version please click here . - This is the exact conversion from TradingView: " PA-Adaptive Hull Parabolic " By "Loxx". - This is a non-repaint and light processing load indicator - You can message in private chat for further changes you need. - All input options are available except candle coloring. - Buffers are available for processing within EAs.
      A simple but very useful indicator that allows you to display the current date and time on the chart. Especially useful when you save your analysis or trades. Features: show local date and time show server date and time show remaining time to end the current timeframe interval customizable display parameters - show/hide date or time set display position set display size set display color works on every timeframe
      Signal trend indicator. Detects the direction of the trend and is coloured accordingly.  Has built in audible and visual alerts when trends change. Can send notifications to your phone or email. Allows Trend and Counter-Trend trading. Works on all timeframes, all currency pairs, metals, indices and cryptocurrencies. Can be used with binary options. Distinctive features No re-drawing; Simple and clear settings; Four types of alerts; Works on all timeframes and all trading tools; Suitable
      This is a signal that mainly diagnoses the current direction based on data analysis, price breakout algorithms, and strategies based on some major indicators. This signal will display all the signals from a historical period on the main chart and is a good choice if you like to show the direction of the signals on the chart. Advantage: Suitable for all breeds. Applies to all cycles. Only one adjustable parameter, easy to use. Notice: This signal only provides all the most probable signals, and u
      Perfect for one minutes high trading and scalping. This indicator is very effective for trading on one minutes, in the hour. A combination of moving averages and STOCHASTICS calculation to produce a very convincing signal every hour. Blue colour signals a buy opportunity. Follow the X signs for possible buy points. The Blue average line serves as possible trend direction and support. Red colour signals a sell opportunity. Follow the X signs for possible sell points. The Red average line serves a
      Trading Sessions Advanced
      Tumelo Patrick Rakotsoane
      4 (1)
      Trading Session Advanced This indicator was designed to indicate trading sessions in a chart. It draws boxes for each trading session in different colours. Trading Sessions: - London Session - New York Session - Tokyo Session - Sydney Session Some currencies are best traded during certain trading sessions. - EUR, GBP & CHF currencies have high volatility during London session.  - USD & CAD currencies have high volatility during New York session. - AUD, NZD & JPY currencies have high volatility
      30% DISCOUNT ! DISCOUNT ! DISCOUNT ONLY FOR 5 USERS at125$ valid for 1 day only.Grab it The PERFECT TREND HIT creates   BUY and SELL  perfect trend   arrow signals based on ADX EMA AND RSI And all filters inbuilt with accurate trend entries. Furthermore, the indicator and template display the trend direction, strength, and trade recommendation for independent price charts. ROCK WITH THE TREND Moreover, it shows the final trade recommendation to BUY or SELL with all filters and displays that info
      This indicator alerts you when/before new 1 or 5 minute bar candle formed. In other words,this indicator alerts you every 1/5 minutes. This indicator is especially useful for traders who trade when new bars formed. *This indicator don't work propery in strategy tester.Use this in live trading to check functionality. There is more powerful Pro version .In Pro version,you can choose more timeframe and so on. Input Parameters Alert_Or_Sound =Sound ----- Choose alert or sound or both to notify y
      FREE
      Bu ürünün alıcıları ayrıca şunları da satın alıyor
      Magic M2
      Tuan Anh Dao
      4.5 (8)
      ------ GOOD LUCK   -----   (Telegram: @MagicBinary) The indicator allows you to trade binary options. T his indicator give high winning ratio with over 20 years of backtesting  The recommended time frame is М1 and the expiration time is 3, 5 minutes. The indicator suitable for Auto and Manual trading. A possible signal is specified as a arrows above/under a candle. You can entry current candle /intrabar or can wait until candle close Arrows are not re-painted Trade sessions: Any/ Rec
      Trade Invest Pro - Kripto para dünyasında patron! Bu gösterge kripto para ticareti için idealdir! Trade Invest Pro üzerinde çalışmak yarım yılımızı aldı! Ama boşuna değil! Şimdi sadece destek yakınında doğru sinyaller - direnç seviyeleri! İkili opsiyonlar için m5 m15 zaman dilimlerinde kendini iyi gösterdi! İsteğe bağlı olarak, m30 ve daha fazlası için forex için yapılandırılabilir! Haberlere iyi tepki veriyor! boyamaz! ve programdan kaybolmaz! Kırmızı ok göründüğü anda, düşüş için bir
      Dark Sniper
      Dmitriy Kashevich
      Dark Sniper pointer indicator.  Complete absence of redrawing   The percentage of correct indicator forecasts depends on your settings; the default is period 7 (performed better) The arrow indicates the direction of the next candle and the possible direction of the trend in the future.  Suitable for small timeframes m1 and m5  It is recommended to open transactions from 1 to 2 candles.  The signal appears on the current candle. Open a trade on the next one since the signal is being generat
      Bomb Bank Signal
      Igor Pereira Calil
      5 (1)
      Bomb Bank Signal: Your Trusted Indicator for MetaTrader 4 The Bomb Bank Signal is a powerful indicator for MetaTrader 4, designed to identify the most relevant trends in the financial market. If you are looking for a tool that accurately anticipates movements, Bomb Bank is the ally you need. How it Works: This indicator combines three distinct methods – volume analysis, candle closes and symmetrical trend – to detect and signal buying and selling opportunities. Bomb Bank is like a "bomb" whe
      İŞLEM HIZI, piyasada büyük emirlerin nerede ve ne zaman biriktiğini ve bunun faydalarını gösteren en kaliteli göstergedir. Trend değişikliklerini çok erken aşamada tespit eder. Aynı anda hem bir gösterge hem de bir ticaret sistemidir. Konsept benzersiz ve inanılmaz derecede karlı. Forex'te tik hacmi oldukça yanıltıcı bir şekilde hacim olarak adlandırılır. Aslında, fiilen İŞLEM HIZI olan birim zaman başına fiyat değişimidir. Bu gösterge, Forex'teki hacim fikrini mantıksal olarak doğru şekilde t
      Smooth price for Monarch MT4
      Konstantin Gruzdev
      3.67 (3)
      The Smooth Price technical indicator is used for plotting a smoothed line as close to the price of the financial instrument as possible, and serves to eliminate its noise components. The indicator is part of the Monarch trading system, but here it is presented as an independent technical analysis tool. The indicator is based on the cluster digital filter , which, unlike the ClusterSMA , is applied directly to the price time series. Smooth Price does not redraw (except the very last, zero bar) an
      Robot Choppiness
      Diego Mauricio Padilla Mendez
      3 (2)
      Choppines robotu, MT4 göstergeler klasörüne bir gösterge olarak yüklenir Mum zamanlamasının 5 dakika kullanılması tavsiye edilir, tavsiye edilen robotun son kullanma süresi 5 dakikadır. Robot, MT2, MX2, PRICEPRO platformlarına sinyal gönderecek şekilde yapılandırılabilir. Sinyal göndermek için çalışmak istediğimiz platformun konnektör programını kullanmalısınız. Konektörü takmak için aşağıdaki prosedürü gerçekleştirin (MT2 platform konektörüyle yapılandırmayı açıklayan bir resim ektedir): 
      Market Interest
      Paul Edunyu Carissimo
      Piyasa Faiz Göstergesi: Ticaret Duygusu Analizinde Avantajınız Temel Faydalar: Gerçek zamanlı piyasa katılımcısı katılımını nicelleştirir Fiyat hareketini ve hacim dinamiklerini harmanlar Geleneksel göstergelerin ötesinde gizli piyasa duyarlılığını ortaya çıkarır Birden fazla zaman dilimi ve varlığa uyarlanabilir Potansiyel trend değişimleri için erken uyarı sistemi Tüccar Avantajları: Pazar coşkusunun arttığı/azaldığı dönemleri belirleyin Potansiyel momentum değişikliklerini tespit edin Hassasi
      Oni Scalper
      Goh Cheng Wai
      3.67 (3)
      Dear Onis, This Indicator is used for   GBPUSD, US30 and GOLD on 1-Min Chart . For US30 , Depending on your broker, Minimum Lot Size will differ from 0.01 to 1.0 lots. My Current Account is trading at 1.0 lots at $1 per point . Please check with your Broker what's the Margin Required for your Minimum lot sizes before you trade on your Real account. I have Forward Tested the indicator for around 6 months before releasing it to the public. ( No Demo is available for the Indicator, Strategy Teste
      Risk Reward ratio indicator for MT4  BING Risk Reward indicator is a powerful, basic, very needed tool for every trader. Clearly visualize Open Price , Stop Loss , and Top Profit levels on your graphs with easy-to-see colors and trendlines. Does BING Risk Reward show alerts? Of course! BING Risk Reward Indicator offers all Alerts available for the MT4 platform(Email, Popups, Sound, and Push). It shows alerts on Open Price , Stop Loss , and Top Profit. That way, besides easily seeing what is go
      Automatic, live & interactive picture of all trendlines. Assign push, email and sound alerts to the lines of your choice and be informed about price rollback, breakout, rollback after breakout, number of rollbacks, line expiration by double breakout. Correct, drag or delete the lines and interactively tune the line system. https://youtu.be/EJUo9pYiHFA . Chart examples https: //www.mql5.com/en/users/efficientforex Price Interaction Events All events are effective immediately and only after one
      The indicator displays the probable ( Support and resistance ) levels. The indicator draws horizontal and trend levels of support and resistance. The indicator settings: Trends - the mode for displaying trend lines or horizontal lines of support and resistance Yes - display trend lines only No - display horizontal lines only UseResource - use the resources built into the indicator. Yes - use the ZigZag indicator from the resources of the product. No - use a custom ZigZag indicator. HistoryBar -
      The indicator of a Professional Trader is an arrow indicator for predicting the direction of price movement. I have been working on this indicator since 2014. You can use this indicator as your main indicator, use its entry signals, and use it as your only indicator to find entry points. About the product: Recommended TF [H4-D1-W1]   . The indicator predicts the direction of the next candle. Fits a variety of tools; Flexibility in settings for different instruments and intervals through the MO
      The [GRAFF] III manual trading system is based on multiple MetaTrader (MT4) indicators. Together, the entire PACK of GRAFF III indicators makes an advanced trading tool. The system consists of over 20 different custom-built indicators which have been carefully selected and tested in the long term to produce strong and efficient trading signals. The particular indicators are based on different mathematical formulas, so the entire system is calibrated to remove false signals from its own indicator
      You can fins our other products from link : https://www.mql5.com/en/users/drbastem/seller   Also, you can ask all your questins from email : haskayafx@gmail.com or mobile : +90 530 867 5076 or @MehmetBastem    on telegram application This indicator is used to determine the trend. Standard Osma indicator is used. It has the indicator warning system: beep, e-mail and has three types of alerts, including messages to mobile phone. It shows the best performance on the chart of 5 minutes. When the
      You can fins our other products from link : https://www.mql5.com/en/users/drbastem/seller   Also, you can ask all your questins from email : haskayafx@gmail.com or mobile : +90 530 867 5076 or @MehmetBastem    on telegram application This indicator is used to determine the trend. Standard Three Moving Average and ADX indicators are used. It has the indicator warning system (audio, e-mail) and three types of alerts, including messages to mobile phone. It shows the best performance on M5. When
      This indicator is used to determine the trend. Standard Three Moving Average and ADX indicators are used. It has the indicator warning system (audio, e-mail) and three types of alerts, including messages to mobile phone. It shows the best performance on M5. When the trend value reaches the value set, the warning system is activated. This indicator works only with Forex symbols. Inputs SoundAlarm = true - Sound Alert Sendmail=true - Send an e-mail in case of a buy or sell signal Sendnotification
      You can fins our other products from link : https://www.mql5.com/en/users/drbastem/seller   Also, you can ask all your questins from email : haskayafx@gmail.com or mobile : +90 530 867 5076 or @MehmetBastem    on telegram application This indicator is used to determine the trend. Standard MACD indicator is used. It has the indicator warning system: beep, e-mail and has three types of alerts, including messages to mobile phone. It shows the best performance on the chart of 5 minutes. When the
      A simplistic indicator informing a user on RSI divergence by sending messages to mobile device and email. The indicator draws 2 vertical lines, marking two RSI extrema that formed the divergence. You get the alert, open the charts and make a decision. The indicator does not show past divergences, thus when you attach it to a chart for the first time you see nothing. Graphics and alerts will appear as soon as divergences do. Drop it in Tester to see how it works. Parameters: RSIPeriod - number of
      Pan PrizMA CD Phase is an analogue of the МetaТrader 5 indicator , and is an option based on the Pan PrizMA indicator. Details . Averaging by a quadric-quartic polynomial increases the smoothness of lines, adds momentum and rhythm. Extrapolation by the sinusoid function near a constant allows adjusting the delay or lead of signals. The value of the phase - wave status parameter (which is close in meaning to the trigonometric phase or the angle of the radius-vector rotation in the trigonometric p
      Green Wall Arrows
      Daniel Luchinger
      1 (1)
      The Name Green Wall : Arrows hits a lot of TP, by changing the idea of non using SL as something bad, but instead use Small TP and a lot of free Margin and Patience. Use micro TP and a lot of Free Margin with this indicator on Forex. It also can be used with Binary Options. This strategy is intended to be traded Manually. This Indicator runs on Open Bar, arrows will delete when price are against it. The only Indicator Parameter is Alerts true/false, all the rest is included inside the code. Arro
      Golden Monowave is monowave indicator, the monowave theory is one of Elliott wave approach and one of most complicate and accurate method. Golden Monowave can shortcut many major steps to identify and describe the monowave. It works on any timeframe and with any trading instrument, including currencies, indices, futures, etc. Input Parameters initial_Bars - set the initial number of bars to calculate. wave_color - select the color of the wave. label_color - select the color of labels. temp_labe
      Ticks Size
      Viktor Kolmakov
      This indicator displays in a separate window the difference between the number of points which increased the price, and the number of points that decreased the price during the time interval specified in the settings. The time interval for calculation is expressed as the number of bars of the chart the indicator is attached to. This approach allows you to evaluate the movement direction (growth or fall) of the instrument's price, the strength of the movement and the size of the movement in point
      NostradamusMT4
      Andrey Spiridonov
      1 (1)
      NostradamusMT4 is a powerful indicator from the set of professional trader. The indicator is based on Andrei Spiridonov's original price calculation method (ESTIMATED PRICE) for the current candle price. Advantages The indicator does not redraw. It works on any timeframes. Works with any trading instruments. Perfectly suitable for scalping and trading binary options. Parameters Color - color of the ESTIMATED PRICE FUTURE line. How to work with the indicator The indicator forms the ESTIMATED P
      BinaryIndicator is a highly accurate indicator for trading binary options. It shows excellent results in scalping. This indicator is based in multifactor analysis of trend indicators, as well as confirmation oscillators, which in the end gives an increased accuracy of signals. Advantages of the indicator Increased accuracy of signals. Excellent results when trading binary options with a short expiration time from M30 to M1 . It works on any timeframes. Works with any trade symbols. Parameters
      FutureTrade
      Andrey Spiridonov
      3 (2)
      FutureTrade is one of the few indicators that predicts the price right on the price chart. The indicator calculation algorithm is based on the fast Fourier transform. Given the oscillatory behavior of the price, the Fourier function predicts its future behavior. The indicator should be attached in the usual way to a chart with the trading instrument specified symbol and with the M15 timeframe. This timeframe is the most optimal for working with any symbols. Once started, the indicator calculates
      XCalper Triad MT4
      Aecio de Feo Flora Neto
      xCalper Triad works as a Target scanner tool. Its algorithm calculates price level areas with high precision and instantly. By default, they are automatically identified and the trader normally sets visual parameters only. Explore a new perspective in price action analysis by adding Triad to your setup and surprise yourself. Main Features Automatic & exclusive Target levels Daily candle representation in all intraday timeframes. Side panel information essential to all traders: Remaining time to
      BinaryScalping
      Andrey Spiridonov
      BinaryScalping is a professional indicator for trading binary options and scalping. The algorithm of the indicator is based on the calculation of pivot points for each time period separately, the location of the price of the trading instrument relative to the pivot points is analyzed and the probability of a trading operation is calculated. The indicator has a built-in filter of trading signals based on the global trend. The indicator is installed in the usual way and works with any trading inst
      Primus Trading Engine is a trading system that combines price action,ratio based indicators & custom indicators to create this leading indicator with a multi-timeframe approach to give you high probability trade setups for forex,CFD cash/futures,metals & binary option to assist in making predictions on what is MOST likely to happen in the market Main Chart Features Price Action Signal-Arrow displayed on a specific bar;NOT buy/sell arrow;DOES NOT repaint;Bullish arrow on a bullish bar,price is l
      Yazarın diğer ürünleri
      Advanced Detector of Trend Reversal and Continuance known as TrueTrendStar(TTS) is a sensitive and Predictive indicator of Price Trends for Professional traders. ( WEEKEND DISCOUNT ON 10%!!!  ) ( ATTENTION BUYERS:- PLEASE CONTACT SELLER FOR HOW BEST TO USE THE INDICATOR FOR MAXIMUM PROFITS )    This indicator detects advanced signals of high odds changes in Price Trend direction long before other indicator detects it. I have been working on it since 2019.    This is possible due to fractal n
      Filtrele:
      İnceleme yok
      İncelemeye yanıt
      Sürüm 1.1 2025.03.15
      code optimisation