• Genel bakış
  • İncelemeler
  • Yorumlar

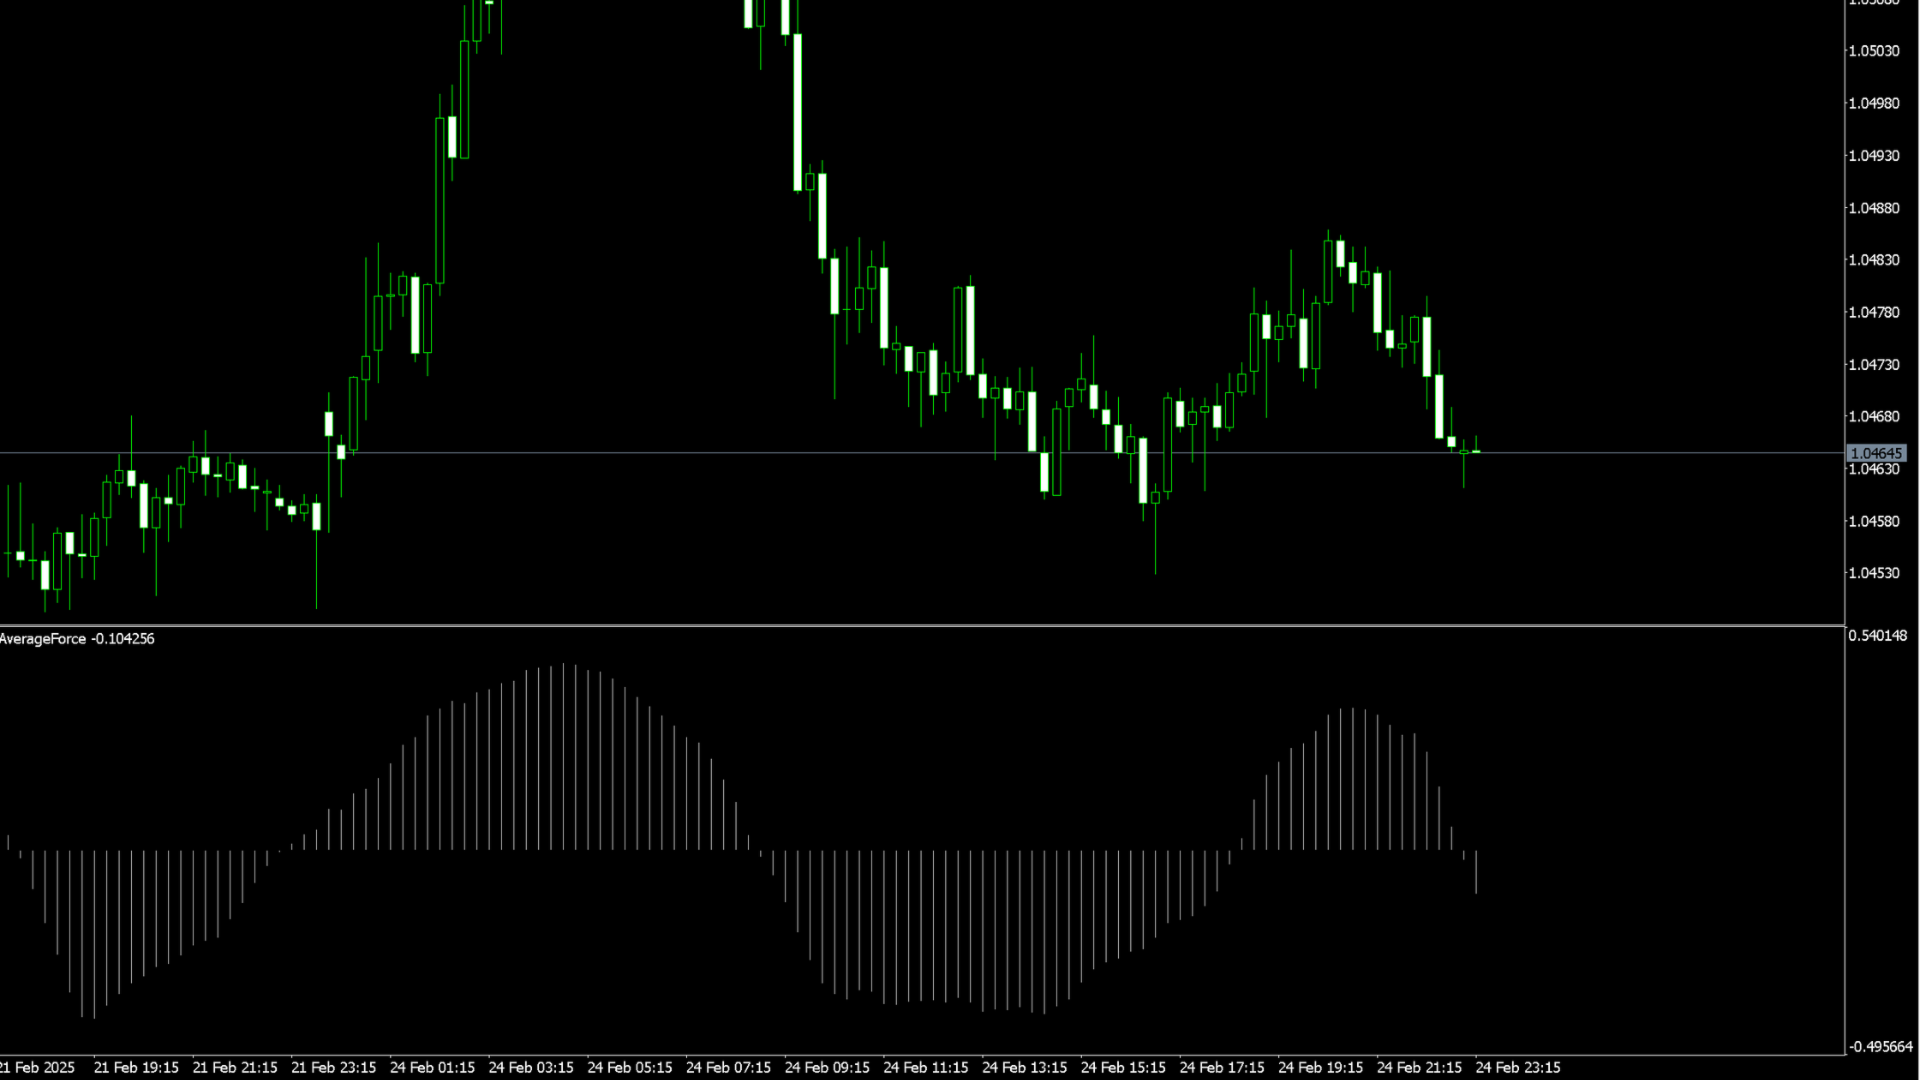
Average Force by Gerega

The Average Force Indicator is a technical analysis tool designed to measure the strength of price movements by analyzing both momentum and volatility. This indicator is based on the Force Index, which combines price changes and volume data, but with a smoothing mechanism to provide a clearer and more stable reading of market dynamics.


Key Features:

Momentum and Trend Strength Measurement– Helps traders identify the intensity of buying or selling pressure.

Smoothed Force Index Calculation– Reduces noise and provides a more reliable trend indication.

Adaptable to Different Trading Styles– Suitable for scalping, swing trading, and long-term analysis.

Divergence Signals– Can highlight potential reversals when price action and force index diverge.

Works on Multiple Timeframes– Effective in different market conditions, from Forex to stocks and cryptocurrencies.


The Average Force Indicator is an excellent tool for traders looking to gauge market strength, confirm trends, and anticipate potential reversals with a balanced approach to price and volume analysis.


Önerilen ürünler
QuantumAlert RSI Navigator is a free indicator available for MT4/MT5 platforms, its work is to provide "alerts" when the market is inside "overbought and oversold" regions in the form of "buy or sell" signals. This indicator comes with many customization options mentioned in the parameter section below, user can customise these parameters as needful. Join our MQL5 group , where we share important news and updates. You are also welcome to join our private channel as well, contact me for the priva
FREE
Super Trading Scaleur
Titouan Sebastien Julien Cadoux
Super Trading Scalper Otomatik Scalping için Güçlü Bir Çözüm Super Trading Scalper, teknik bir osilatöre dayalı gelişmiş analiz kullanarak piyasa hareketlerinden yararlanmak için tasarlanmış sofistike bir Expert Advisor (EA) 'dır. Bu araç, pürüzsüz, otomatikleştirilmiş ve yüksek güvenlikli bir ticaret arayan intraday trader'lar ve scalper'lar için özel olarak tasarlanmıştır. Lütfen robotu kullanırken/test ederken ekran görüntülerinde gösterilen girişleri kullanın. Ana Özellikler Teknik bir osil
Value Chart Candlesticks
Flavio Javier Jarabeck
4.73 (11)
The idea of a Value Chart indicator was presented in the very good book I read back in 2020 , " Dynamic Trading Indicators: Winning with Value Charts and Price Action Profile ", from the authors Mark Helweg and David Stendahl. The idea is simple and the result is pure genius: Present candlestick Price analysis in a detrended way! HOW TO READ THIS INDICATOR Look for Overbought and Oversold levels. Of course, you will need to test the settings a lot to find the "correct" one for your approach. It
FREE
Schaff Trend Cycle signals
Smaylle Rafael Coelho Mariano
The   Schaff Trend Cycle (STC)   is a technical analysis tool designed to help traders identify trends and potential reversals in the market. It combines elements of cycle analysis and moving averages, making it particularly useful for predicting price movements in various financial instruments, including forex   1 . Key Features Predictive Nature : The STC is known for its ability to provide early signals about potential trend changes. This makes it a valuable tool for forex traders looking to
FREE
Lion macd
Paul Conrad Carlson
This Expert trades macd crosses , using ADX and AC. Designed for 4hr EURUSD trading but able to trade major pairs. Code is designed for speedy metatrader optimisation using open price testing as ea uses open prices on indicators used. EA identifies trends  with specific momentum and exits using the ADX or stop loss. Please optimise using out of sample data.  preset at 0.1 lots best to start with 0.01 lots.
FREE
QuantumAlert Stoch Navigator is a free indicator available for MT4/MT5 platforms, its work is to provide "alerts" when the market is inside "overbought and oversold" regions in the form of "buy or sell" signals. This indicator comes with many customization options mentioned in the parameter section below, user can customise these parameters as needful. Join our   MQL5 group , where we share important news and updates. You are also welcome to join our private channel as well, contact me for the p
FREE
Shape Pack MT5
John Louis Fernando Diamante
This indicator provides common shapes as drawing object options. The shapes are rotatable, resizable, draggable, and will keep their proportions (according to their handle trendline) across different chart scales. Multiple drawings are supported. Shapes: Square Rhombus Triangle (quadrilateral & isosceles) Circle (grid, overlapped grid, flexi grid, rotatable grid, concentric circles) Features: rays (all object edges will be rays) show/hide each individual drawing type, or all delete last drawn ob
FREE
Candle Colors
Paulo Henrique Da Silva
The Color Candles Indicator uses custom colors to highlight candles that follow the main market trend, based on the Moving Average. This simplifies the analysis of price movements, making it clearer and more direct. When the price is above the rising Moving Average, candles are highlighted indicating a BUY opportunity. When the price is below the declining Moving Average, candles are highlighted indicating a SELL opportunity. Input Parameters : Period Method Applied Price The moving averages
FREE
Стрелочный индикатор, выдающий сигнал при пересечении 2 SMA. Сигналы выдаются в виде стрелок и подходят для торговли бинарными опционами.  Это демо версия индикатора, в не нельзя изменять параметры. Полная версия .  Входные параметры First period-  период 1 MA Second period -  период 2 MA Invert signals -  Возможность давать инвертированные сигналы (для работы по тренду) Candles to count  - количество свечей для подсчета статистики Expiration - время экспирации сигнала Length - расстояние для
FREE
Bar Color Trend
Germano Chagas
4.38 (8)
Combining the best of Price Action , Directional Movement , and Divergence/Convergence analysis, Candle Color Trend is a easy and reliable way to identify trend direction. The indicator automatically paints the candles according to the assumption that an uptrend is defined by prices that form a series of higher highs and higher lows. In contrast, a downtrend is defined by prices that form a series of lower highs and lower lows. Additionally, ADX Wilder indicator is used to measure trend weakness
FREE
Account Dashboard Statistics MT5
Nestor Alejandro Chiariello
5 (1)
Hesap Panosu İstatistikleri Hesabınızın kar ve zararlarını bilmek, böylece takip edebilmeniz için odaklanmış bir görüşe sahip olmanıza yardımcı olacak bir araçtır, aynı zamanda elde edilen riski bilmek için bir düşüş analizi de getirir. Hesabınızda indirip etkinleştirdikten sonra, onu herhangi bir sembole, örneğin EURUSD H1'e eklemelisiniz, ardından bu andan itibaren araç istatistiklerinizi izlemeye başlayacaktır. panel tamamen gelişmiştir, gizleyebilir ve istediğiniz yere taşıyabilirsiniz he
FREE
MQL5 Description for "Elmex Trend Finder" The Elmex Trend Finder (ETF) The Elmex Trend Finder is a state-of-the-art trend-following indicator built on a foundation of advanced quantitative techniques: Fourier Transform approximation, Kalman Filtration, and dual Exponential Moving Averages (EMAs) of different lengths. This seamless integration allows the indicator to detect market trends with precision, ensuring minimal lag and noise. Designed for traders seeking clear, actionable insights, the
FREE
The indicator plots a curve of the difference between the values ​​of two trading instruments (currency pairs). The purpose of the indicator is to observe the processes of divergence and convergence of the values ​​of two trading instruments. The results obtained can be used for trading strategies of statistical arbitrage, pair trading, correlation, and others. Trading strategy The indicator is attached to the chart of any trading instrument. In the input parameters, the names of trading instr
FREE
True Volatility
Cristian Eriksson
5 (1)
ATR is an excellent indicator to visualize if volatility is increasing or decreasing. But what if you want to compare the volatility to another pair or instrument? Since each pair with different quote currency has different pip value, the output of the ATR doesn't really say that much. Comparing pairs to other instruments is even harder.  What you as a trader care about is how much the pair has moved up or down in percentage, therefore normalizing ATR to percent would make things much easier.  T
FREE
A buy signal can be seen on the dashboard when the previous signal is red and the next signal is green, then the SAR is green and the RSI is green. A Sell Signal can be seen on the dashboard when the previous Signal is green and the Signal after it is red, then the SAR is red and the RSI is red. Line function - shows on the chart the lines of Opening, Stop Loss, Take Profit. With this function, it is easy to create a new order and see its additional characteristics before opening.   TP and SL
FREE
Free automatic Fibonacci is an indicator that automatically plots a Fibonacci retracement based on the number of bars you select on the BarsToScan setting in the indicator. The Fibonacci is automatically updated in real time as new highest and lowest values appears amongst the selected bars. You can select which level values to be displayed in the indicator settings. You can also select the color of the levels thus enabling the trader to be able to attach the indicator several times with differe
FREE
Indicators are professional data statistics, position orders, historical order analysis->>>>>> <This version is in Chinese -> English version please move> Necessary for traders: tools and indicators Waves automatically calculate indicators, channel trend trading Perfect trend-wave automatic calculation channel calculation , MT4 Perfect trend-wave automatic calculation channel calculation , MT5 Local Trading copying Easy And Fast Copy , MT4 Easy And Fast Copy , MT5 Local Trading copying For DEM
FREE
SSACD - Singular Spectrum Average Convergence/Divergence This is an analogue of the MACD indicator based on the Caterpillar-SSA ( Singular Spectrum Analysis ) method. Limited version of the SSACD Forecast indicator. Limitations include the set of parameters and their range. Specificity of the method The Caterpillar-SSA is an effective method to handle non-stationary time series with unknown internal structure. The method allows to find the previously unknown periodicities of the series and make
FREE
YKL Multiple Regression
Ygor Keller Luccas
5 (1)
Indicador Multiple Regression Indicador faz o plot da  Curva de Retorno  e dos canais superior e inferior de uma  regressão para os preços de fechamento do ativo do gráfico. A  Curva de Retorno  é a linha central do indicador e representa a região de equilíbrio do preço entre vendedores e compradores. Nesse indicador o usuário escolhe o tipo da regressão podendo ser de 3 tipos: primeiro grau, segundo grau ou terceiro grau. Os plots do indicador são: Linha central – cor padrão preta; Linha superi
FREE
QuantumAlert CCI Navigator is a free indicator available for MT4/MT5 platforms, its work is to provide "alerts" when the market is inside "overbought and oversold" regions in the form of "buy or sell" signals. This indicator comes with many customization options mentioned in the parameter section below, user can customise these parameters as needful. Join our   MQL5 group , where we share important news and updates. You are also welcome to join our private channel as well, contact me for the pri
FREE
Revolution martingale
Yaroslav Varankin
5 (3)
Revolution Martingale is an indicator designed for trading binary options on the M5 timeframe. Features: M5 Timeframe: It is recommended to use the indicator on the M5 timeframe for optimal trading. Trade Entry: Trades should only be opened on the first candle after a signal appears. Signals: A blue diamond indicates a buying opportunity for upward movement, while a red diamond indicates a buying opportunity for downward movement. Configured for Effective Binary Options Trading: The indicator i
FREE
This indicator uses historical volatility and a 21-period moving average to define the price distortion in relation to the average. The calculation of historical volatility was based on the book (Odds: The Key to 90% Winners) written by Don Fishback. A Volatility Index with a value greater than 30 may indicate that the price is distorted from its fair price. QUESTIONS ABOUT THE  INSTALLATION OF PRODUCTS AT META TRADER You can also find some instructions on how to install a robot in the Me
FREE
Volatility Doctor
Gamuchirai Zororo Ndawana
4.5 (2)
Docteur de la volatilité - Votre conseiller expert pour maîtriser les rythmes du marché ! Êtes-vous prêt à débloquer la puissance du trading de précision ? Rencontrez le Docteur de la volatilité, votre compagnon de confiance dans le monde dynamique des marchés Forex. Cet expert-conseil multi-devises n'est pas seulement un outil de trading ; c'est un chef d'orchestre symphonique, guidant vos investissements avec une précision inégalée. Découvrez les principales fonctionnalités : 1. Expertise
FREE
Haven Volume Profile
Maksim Tarutin
3.5 (2)
Haven Volume Profile, ticaret hacminin dağılımına dayalı olarak önemli fiyat seviyelerini belirlemeye yardımcı olan çok fonksiyonlu bir hacim profili analiz göstergesidir. Piyasayı daha iyi anlamak ve önemli giriş ve çıkış noktalarını belirlemek isteyen profesyonel yatırımcılar için tasarlanmıştır. Diğer Ürünler ->  BURADAN Temel Özellikler: Point of Control (POC) Hesaplama - en yüksek ticaret aktivitesinin gerçekleştiği seviye, en likit seviyeleri belirlemeye yardımcı olur Value Area (yüksek ak
FREE
Chaikin's volatility indicator calculates the spread between the maximum and minimum prices. It judges the value of volatility basing on the amplitude between the maximum and the minimum. Unlike Average True Range , Chaikin's indicator doesn't take gaps into account. According to Chaikin's interpretation, a growth of volume indicator in a relatively short space of time means that the prices approach their minimum (like when the securities are sold in panic), while a decrease of volatility in a l
FREE
SuperTrend TV
Tran Nhat Minh
5 (3)
Original supertrend indicator in Tradingview platform.  Indicator type: Price Action indicator Introduction:   The Supertrend Indicator - Enhancing Your Trend Analysis.  If you haven't yet found a Supertrend indicator with good graphics on the MQL5 platform, this is the indicator for you. Overview:   The Supertrend Indicator is a powerful tool designed to provide traders with valuable insights into the current and historical trends of financial markets. It serves as a valuable addition to any t
FREE
Laguerre Filter
Fernando Lahude Ritter
Laguerre Indicator with Gamma Input Overview: The Laguerre Indicator is a sophisticated financial analysis tool designed to provide traders and investors with a dynamic and responsive method to track market trends. Its core functionality is centered around a unique algorithm that adapts to market volatility, offering clearer insights compared to traditional indicators. Key Feature - Gamma Input: Gamma: The sole input for the Laguerre Indicator, 'gamma,' plays a pivotal role in calibrating the i
FREE
Gösterge   Haven FVG   , piyasaları analiz etmek için bir araçtır ve grafikte verimsizlik alanlarını (Fair Value Gaps, FVG) tanımlamanıza olanak tanır, böylece tüccarlara fiyat analizi ve ticari kararlar almak için anahtar seviyeler sağlar. Diğer ürünler ->  BURADA Ana Özellikler: Bireysel renk ayarları: Alış FVG rengi   (Bullish FVG Color). Satış FVG rengi   (Bearish FVG Color). Esnek FVG görselleştirme: FVG aramak için maksimum mum sayısı. FVG bölgelerinin belirli bir bar sayısı kadar ek uzat
FREE
Dsc Oscillator
Diogo Sawitzki Cansi
Recomended broker: https://tinyurl.com/5ftaha7c Indicator used to monitor price fluctuations in the market and discover possible reversals through reversal points or divergences in the indicator. All assets and all timeframes.   SEE OUR RESULTS ON INSTAGRAM:  https://www.instagram.com/diogo.cansi/   TELEGRAM GROUP =  https://t.me/robosdsc More information by email dscinvestimentos@gmail.com or by Whatsapp 55-991372299
FREE
HiperCube Renko Mumlarına Hoş Geldiniz Darwinex Zero'da %25 indirim kodu: DWZ2328770MGM Bu gösterge size gerçek piyasa bilgisi sağlar ve onu Renko Mum Stiline dönüştürür. Tanım Renko grafikleri, fiyat hareketlerini temsil etmek için tuğlalar (veya çubuklar) kullanarak fiyat değişimlerini ölçen ve çizen bir tür finansal grafiktir. Geleneksel mum grafiklerinin aksine, Renko grafikleri yalnızca fiyat dalgalanmalarına odaklanarak zaman tabanlı bilgileri görüntülemez. Özellikler: Ayrı pencerelerde
FREE
Bu ürünün alıcıları ayrıca şunları da satın alıyor
Trend Screener Pro MT5
STE S.S.COMPANY
4.84 (76)
Trend Göstergesi, Trend Alım Satım ve Filtreleme için Çığır Açan Benzersiz Çözüm, Tüm Önemli Trend Özellikleriyle Tek Bir Araç İçinde Yerleştirildi! Forex, emtialar, kripto para birimleri, endeksler ve hisse senetleri gibi tüm sembollerde/araçlarda kullanılabilen %100 yeniden boyamayan çoklu zaman çerçevesi ve Çoklu para birimi göstergesidir. Trend Screener, grafikte noktalarla ok trend sinyalleri sağlayan etkili bir trend trend göstergesidir. Trend analizörü göstergesinde bulunan özellikler: 1.
Golden Trend Indicator MT5
Noha Mohamed Fathy Younes Badr
4.88 (16)
Golden Trend indicator  is The best indicator for predicting trend movement this indicator never lags and never repaints and never back paints    and give  arrow buy and sell    before the candle appear  and it will help you and  will make your trading decisions clearer its work on all currencies and  gold and crypto and all time frame This unique  indicator uses very secret algorithms to catch the  trends, so you can trade using this indicator and see the trend clear on charts  manual guide and
TPSpro RFI Levels MT5
Roman Podpora
4.53 (19)
TALİMATLAR         RUS   -        ENG       Bir gösterge ile kullanılması   önerilir       -       TPSpro   TREND PRO -   Sürüm MT4         Ticarette önemli bir unsur, bir ticaret aracını satın alma veya satma kararlarının alındığı bölgeler veya seviyelerdir. Büyük oyuncuların piyasadaki varlıklarını gizleme girişimlerine rağmen, kaçınılmaz olarak izler bırakırlar. Bizim görevimiz bu izleri nasıl tanımlayacağımızı ve doğru şekilde nasıl yorumlayacağımızı öğrenmekti. Ana işlevler:: Satıcılar ve
FX Power MT5 NG
Daniel Stein
5 (11)
FX Power: Daha Akıllı Ticaret Kararları için Para Birimlerinin Gücünü Analiz Edin Genel Bakış FX Power , her piyasa koşulunda başlıca para birimlerinin ve altının gerçek gücünü anlamak için vazgeçilmez bir araçtır. Güçlü para birimlerini alıp zayıf olanları satarak, FX Power ticaret kararlarınızı basitleştirir ve yüksek olasılıklı fırsatları ortaya çıkarır. İster trendlere sadık kalın ister Delta'nın aşırı değerlerini kullanarak tersine dönüşleri öngörün, bu araç ticaret tarzınıza mükemmel bir
FX Volume MT5
Daniel Stein
4.82 (17)
FX Volume: Bir Broker’ın Perspektifinden Gerçek Piyasa Duyarlılığını Deneyimleyin Kısa Özet Trading yaklaşımınızı bir adım öteye taşımak ister misiniz? FX Volume , perakende traderlar ile brokerların nasıl konumlandığını gerçek zamanlı olarak sunar—COT gibi gecikmeli raporlardan çok daha önce. İster istikrarlı kazançları hedefliyor olun, ister piyasada daha güçlü bir avantaj arayın, FX Volume önemli dengesizlikleri belirlemenize, kırılmaları (breakout) doğrulamanıza ve risk yönetiminizi iyileş
FX Levels MT5
Daniel Stein
5 (3)
FX Levels: Tüm Piyasalar İçin Son Derece Hassas Destek ve Direnç Hızlı Bakış Döviz kurları, endeksler, hisseler veya emtialar gibi herhangi bir piyasada güvenilir destek ve direnç seviyeleri belirlemek mi istiyorsunuz? FX Levels geleneksel “Lighthouse” yöntemini ileri düzey bir dinamik yaklaşımla birleştirerek neredeyse evrensel bir doğruluk sağlar. Gerçek broker deneyimimize ve otomatik günlük güncellemeler ile gerçek zamanlı güncellemelerin birleşimine dayalı olarak, FX Levels size dönüş nok
TPSproTREND PrO MT5
Roman Podpora
4.71 (17)
TPSpro TREND PRO  - is a trend indicator that automatically analyzes the market and provides information about the trend and each of its changes, as well as giving signals for entering trades without redrawing! The indicator uses each candle, analyzing them separately. referring to different impulses - up or down impulse. Exact entry points into transactions for currencies, crypto, metals, stocks, indices!  ИНСТРУКЦИЯ RUS         INSTRUCTIONS  ENG       R ecommended to use with an indicator   -
Matrix Arrow Indicator MT5
Juvenille Emperor Limited
5 (13)
Matrix Arrow Indicator MT5 ,   forex ,   emtialar ,   kripto   para birimleri ,   endeksler ,   hisse senetleri   gibi tüm sembollerde/araçlarda kullanılabilen   %100 yeniden boyamayan   çoklu zaman çerçevesi göstergesini izleyen benzersiz bir 10'u 1 arada trenddir.  Matrix Arrow Indicator MT5 , mevcut eğilimi erken aşamalarında belirleyecek ve aşağıdakiler gibi 10'a kadar standart göstergeden bilgi ve veri toplayacaktır: Ortalama Yönlü Hareket Endeksi (ADX) Emtia Kanal Endeksi (CCI) Klasik Hei
IX Power MT5
Daniel Stein
4.86 (7)
IX Power: Endeksler, Emtialar, Kripto Paralar ve Forex Piyasaları için İçgörüler Genel Bakış IX Power , endeksler, emtialar, kripto paralar ve forex sembollerinin gücünü analiz etmek için tasarlanmış çok yönlü bir araçtır. FX Power , tüm kullanılabilir döviz çiftlerinin verilerini kullanarak döviz çiftleri için maksimum doğruluk sağlarken, IX Power yalnızca temel sembolün piyasa verilerine odaklanır. Bu, IX Power 'ı forex dışındaki piyasalar için ideal ve daha basit forex analizleri için güven
This indicator is based on the mathematics of the great trader W.D. Ganna. With its help, you can easily find strong levels by analyzing swings to find the optimal entry point. The indicator works on all instruments and all timeframes. The indicator is fully manual and has control buttons. All you need to do is press the NEW button, a segment will appear, which you can place on any movement, swing or even 1 candle that you want to analyze. By placing the segment, press the OK button. A grid (th
Quantum TrendPulse
Bogdan Ion Puscasu
5 (13)
SuperTrend   ,   RSI   ve   Stochastic'in   gücünü tek bir kapsamlı göstergede birleştirerek işlem potansiyelinizi en üst düzeye çıkaran nihai işlem aracı olan   Quantum TrendPulse'u   tanıtıyoruz. Hassasiyet ve verimlilik arayan yatırımcılar için tasarlanan bu gösterge, piyasa trendlerini, momentum değişimlerini ve en uygun giriş ve çıkış noktalarını güvenle belirlemenize yardımcı olur. Temel Özellikler: SuperTrend Entegrasyonu:   Güncel piyasa trendlerini kolayca takip edin ve karlılık dalgası
FX Dynamic: Özelleştirilebilir ATR Analiziyle Volatilite ve Trendleri Takip Edin Genel Bakış FX Dynamic , ortalama gerçek aralık (ATR) hesaplamalarını kullanarak günlük ve gün içi volatilite hakkında rakipsiz bilgiler sağlayan güçlü bir araçtır. 80%, 100%, 130% gibi net volatilite eşikleri ayarlayarak, piyasa olağan hareketlerinin ötesine geçtiğinde hızlı şekilde uyarı alabilir ve potansiyel kazanç fırsatlarını süratle tespit edebilirsiniz. FX Dynamic , brokerınızın zaman dilimine uyum sağlaya
Gold Stuff mt5
Vasiliy Strukov
4.92 (173)
Gold Stuff mt5, özellikle altın için tasarlanmış bir trend göstergesidir ve herhangi bir finansal enstrümanda da kullanılabilir. Gösterge yeniden çizilmez ve gecikmez. Önerilen zaman dilimi H1. Ayarları ve kişisel bir bonusu almak için satın alma işleminden hemen sonra benimle iletişime geçin!  Güçlü Destek ve Trend Tarayıcı göstergemizin ücretsiz bir kopyasını pm'den alabilirsiniz. Ben!   AYARLAR Ok Çiz - açık kapalı. grafik üzerinde oklar çizmek. Uyarılar - sesli uyarılar kapalı. E-posta b
This indicator identifies and displays zones, as it were areas of strength, where the price will unfold. The indicator can work on any chart, any instrument, at any timeframe. The indicator has two modes. The indicator is equipped with a control panel with buttons for convenience and split into two modes. Manual mode: To work with manual mode, you need to press the NEW button, a segment will appear. This segment is stretched over the movement and the LVL button is pressed. The level is displayed
Öncelikle, bu Ticaret Aracının Non-Repainting, Non-Redrawing ve Non-Lagging Gösterge olduğunu vurgulamakta fayda var, bu da onu profesyonel ticaret için ideal hale getiriyor. Çevrimiçi kurs, kullanıcı kılavuzu ve demo. Akıllı Fiyat Hareketi Kavramları Göstergesi, hem yeni hem de deneyimli tüccarlar için çok güçlü bir araçtır. İleri ticaret fikirlerini, Inner Circle Trader Analizi ve Smart Money Concepts Ticaret Stratejileri gibi 20'den fazla kullanışlı göstergeyi bir araya getirerek bir araya
Support And Resistance Screener, MetaTrader için tek bir gösterge içinde birden fazla araç sağlayan tek bir Düzey göstergesindedir. Kullanılabilir araçlar şunlardır: 1. Piyasa Yapısı Eleme Aracı. 2. Geri Çekilme Bölgesi Boğa. 3. Geri Çekilme Bölgesi Ayı. 4. Günlük Pivot Noktaları 5. haftalık Pivot Noktaları 6. aylık Pivot Puanları 7. Harmonik Modele ve hacme dayalı Güçlü Destek ve Direnç. 8. Banka Seviyesi Bölgeleri. SINIRLI SÜRELİ TEKLİF : YG Destek ve Direnç Göstergesi sadece 50 $ ve ömür boyu
PUMPING STATION – Forex'te Kâr Pompanız! Size PUMPING STATION 'ı sunuyoruz — ticaretinizi bir kâr makinesine dönüştürecek devrim niteliğinde bir Forex göstergesi! Bu gösterge sadece bir yardımcı değil, aynı zamanda güçlü algoritmalarıyla size düzenli kazanç sağlamaya yardımcı olacak tam teşekküllü bir ticaret sistemidir. Bu ürünü satın aldığınızda, ek olarak ÜCRETSİZ olarak şunları alacaksınız: Otomatik ayarlama ve maksimum sonuç için özel ayar dosyaları. PUMPING STATION stratejisiyle nasıl tic
Bu gösterge paneli, seçilen semboller için mevcut en son   harmonik kalıpları   gösterir, böylece zamandan tasarruf edersiniz ve daha verimli olursunuz /   MT4 sürümü . Ücretsiz Gösterge:   Basic Harmonic Pattern Gösterge sütunları Symbol :   seçilen semboller görünecektir Trend:   yükseliş veya düşüş Pattern :   desen türü (gartley, kelebek, yarasa, yengeç, köpekbalığı, cypher veya ABCD) Entry :   giriş fiyatı SL:   zararı durdur fiyatı TP1:   1. kar alma fiyatı TP2:   2. kar alma fiyatı TP
Protect against whipsaws: revolutionize your swing trading approach Swing Trading is the first indicator designed to detect swings in the direction of the trend and possible reversal swings. It uses the baseline swing trading approach, widely described in trading literature. The indicator studies several price and time vectors to track the aggregate trend direction and detects situations in which the market is oversold or overbought and ready to correct. [ Installation Guide | Update Guide | Tro
Top indicator for MT5   providing accurate signals to enter a trade without repainting! It can be applied to any financial assets:   forex, cryptocurrencies, metals, stocks, indices .  Watch  the video  (6:22) with an example of processing only one signal that paid off the indicator! MT4 version is here It will provide pretty accurate trading signals and tell you when it's best to open a trade and close it. Most traders improve their trading results during the first trading week with the help of
PZ Trend Trading MT5
PZ TRADING SLU
3.8 (5)
Capture every opportunity: your go-to indicator for profitable trend trading Trend Trading is an indicator designed to profit as much as possible from trends taking place in the market, by timing pullbacks and breakouts. It finds trading opportunities by analyzing what the price is doing during established trends. [ Installation Guide | Update Guide | Troubleshooting | FAQ | All Products ] Trade financial markets with confidence and efficiency Profit from established trends without getting whip
Easy Breakout MT5
Mohamed Hassan
5 (3)
After your purchase, feel free to contact me for more details on how to receive a bonus indicator called VFI, which pairs perfectly with Easy Breakout for enhanced confluence!     Easy Breakout MT5   is a powerful price action trading system built on one of the most popular and widely trusted strategies among traders: the   Breakout strategy ! This indicator delivers crystal-clear Buy and Sell signals based on breakouts from key support and resistance zones. Unlike typical breakout indicators
FourAverageMT5
Mikhail Sergeev
5 (2)
FourAverage, trend tespitinde yeni bir kelimedir. Bilgi teknolojilerinin ve çok sayıda katılımcının gelişmesiyle birlikte, finansal piyasalar modası geçmiş göstergelerle giderek daha az analiz edilebilir hale geliyor. Hareketli Ortalama veya Stokastik gibi olağan teknik analiz araçları, en saf haliyle trendin yönlerini veya tersine dönmesini belirleyemez. Bir gösterge, parametrelerini değiştirmeden 14 yıllık bir geçmişe göre gelecekteki fiyatın doğru yönünü gösterebilir mi? Aynı zamanda, piyasan
MetaForecast M5
Vahidreza Heidar Gholami
5 (2)
MetaForecast, fiyat verilerindeki harmonileri kullanarak herhangi bir piyasanın geleceğini tahmin eder ve görselleştirir. Piyasa her zaman tahmin edilemezken, fiyatlarda bir desen varsa, MetaForecast geleceği mümkün olduğunca doğru bir şekilde tahmin edebilir. Benzer ürünlere göre, MetaForecast piyasa eğilimlerini analiz ederek daha kesin sonuçlar üretebilir. Giriş Parametreleri Past size (Geçmiş boyut) MetaForecast'ın gelecekteki tahminler oluşturmak için kullandığı çubuk sayısını belirtir. Mo
RelicusRoad Pro MT5
Relicus LLC
4.78 (18)
Şimdi 147 $ (birkaç güncellemeden sonra 499 $ 'a yükseliyor) - Sınırsız Hesaplar (PC'ler veya Mac'ler) RelicusRoad Kullanım Kılavuzu + Eğitim Videoları + Özel Discord Grubuna Erişim + VIP Durumu PİYASAYA BAKMAK İÇİN YENİ BİR YOL RelicusRoad, forex, vadeli işlemler, kripto para birimleri, hisse senetleri ve endeksler için dünyanın en güçlü ticaret göstergesidir ve yatırımcılara kârlı kalmaları için ihtiyaç duydukları tüm bilgileri ve araçları sağlar. Başlangıç ​​seviyesinden ileri seviyeye ka
Atomic Analyst MT5
Issam Kassas
4.32 (19)
Öncelikle belirtmek gerekir ki bu Ticaret Göstergesi Yeniden Çizim Yapmaz, Gecikmez ve Gecikme Göstermez, bu da hem manuel hem de robot ticareti için ideal hale getirir. Kullanıcı kılavuzu: ayarlar, girişler ve strateji. Atom Analisti, Piyasada Daha İyi Bir Avantaj Bulmak İçin Fiyatın Gücünü ve Momentumunu Kullanan PA Fiyat Hareketi Göstergesidir. Gürültüleri ve Yanlış Sinyalleri Kaldırmaya ve Ticaret Potansiyelini Artırmaya Yardımcı Olan Gelişmiş Filtrelerle Donatılmıştır. Birden fazla katmanl
Timeframes Trend Scanner is a trend analyzer or trend screener indicator that helps you know the trend in all timeframes of symbol you're watching. This indicator provides clear & detailed analysis results on a beautiful dashboard, let you able to use this result right away without need to do any additional analysis. Please note that this indicator doesn't work with Strategy Tester. Sorry for that! How it works Step 1: Calculate values of 23 selected & trusted technical indicators (Oscillator &
EXCLUSIVE! JUST  10 COPIES  AVAILABLE!   BONUS AUX VIP Club 2024 : Include EA CAP, CEP, LDH, PSC307 & AO4C to enhance the performance of this tool to its maximum potential  Click Here to Download Files   ( for users only ) FREE Trading Education Available Daily via Zoom --- For More Info or Instant Message Click link ---  https://t.me/abcdwave Transform your trading with the "Five Magic Bullets" Indicator, tailored for traders who embrace the power of Elliott Wave Chaos Theory.
Bill Williams Advanced
Siarhei Vashchylka
5 (9)
Bill Williams Advanced is designed for automatic chart analysis using Bill Williams' "Profitunity" system. The indicator analyzes four timeframes at once. Manual (Be sure to read before purchasing) Advantages 1. Automatically analyzes the chart using the "Profitunity" system of Bill Williams. The found signals are placed in a table in the corner of the screen. 2. Equipped with a trend filter based on the Alligator indicator. Most of the system signals are recommended to be used only according t
Gartley Hunter Multi
Siarhei Vashchylka
5 (9)
Gartley Hunter Multi - An indicator for searching for harmonic patterns simultaneously on dozens of trading instruments and on all possible timeframes. Manual (Be sure to read before purchasing) | Version for MT4 Advantages 1. Patterns: Gartley, Butterfly, Shark, Crab. Bat, Alternate Bat, Deep Crab, Cypher 2. Simultaneous search for patterns on dozens of trading instruments and on all possible timeframes 3. Search for patterns of all possible sizes. From the smallest to the largest 4. All fou
Yazarın diğer ürünleri
This MT5 indicator is a conversion of the UT Bot Alerts indicator by @QuantNomad from TradingView. It utilizes ATR to generate custom candles on the chart while providing strong entry signals based on these candles. All buffers, including those for the custom candles and entry signals, are available, making it easy to integrate into any EA. Additionally, various strategies based on this indicator can be found online, or you can contact me for a custom strategy development.
FREE
The  Order Block Indicator for MT5  is a powerful tool designed for traders who use smart money concepts and institutional trading strategies. It automatically detects key order blocks on the chart, helping traders identify high-probability reversal and continuation zones. Key Features: • Automatic Order Block Detection – Highlights strong buying and selling zones based on price action and volume. • Multi-Timeframe Support – Analyze order blocks across different timeframes for better market in
FREE
The  Linear Regression Candles  indicator is a powerful tool that enhances traditional candlestick analysis by incorporating linear regression techniques. It helps traders visualize market trends more clearly by smoothing price movements and reducing noise. Unlike standard candles, Linear Regression Candles are dynamically calculated based on statistical regression, providing a clearer picture of the prevailing market direction. Key Features: • Trend Identification – Highlights the overall mar
FREE
The  Nadaraya-Watson Envelope  is a non-parametric regression-based indicator that helps traders identify trends, support, and resistance levels with smooth adaptive bands. Unlike traditional moving averages or standard deviation-based envelopes, this indicator applies the Nadaraya-Watson kernel regression , which dynamically adjusts to price movements, reducing lag while maintaining responsiveness. Key Features: • Adaptive Trend Detection – Smooths price action while remaining responsive to m
FREE
The   Chandelier Exit Indicator   for MT5 is a powerful tool designed to help traders manage trades by dynamically adjusting stop-loss levels based on market volatility. It is based on the   Average True Range (ATR)   and follows the trend, placing stop-loss levels above or below price action, depending on the trend direction. This makes it an effective tool for   trend-following strategies, breakout trading, and risk management . Key Features: •   Dynamic Stop-Loss Placement   – Adjusts stop-
FREE
The  Kijun-Sen Envelope  is a powerful trend-following indicator based on the  Kijun-Sen  line from the Ichimoku Kinko Hyo system. This tool creates dynamic upper and lower bands around the Kijun-Sen, forming an envelope that helps traders identify market trends, potential reversals, and overbought/oversold conditions. Key Features: • Trend Confirmation – Helps determine whether the market is in a strong uptrend, downtrend, or ranging phase. • Support & Resistance Zones – The envelope acts as
FREE
The  Andean Oscillator  is a powerful momentum-based indicator designed to help traders identify trends, reversals, and market strength with high precision. Inspired by traditional oscillators like the MACD and RSI, this unique tool smooths out price fluctuations and provides clearer signals for both entry and exit points. Key Features: • Momentum & Trend Detection – Helps traders spot bullish and bearish momentum shifts early. • Smoothed Oscillator – Reduces noise and provides more reliable t
FREE
The  Supertrend Indicator for MT5  is a powerful trend-following tool designed to help traders identify market direction with precision. Based on the Average True Range (ATR), it dynamically adjusts to price movements, making it suitable for various trading styles, including scalping, day trading, and swing trading. Key Features: • Accurate Trend Detection – Clearly identifies bullish and bearish trends with a color-coded trend line. • ATR-Based Volatility Adjustment – Adapts to market conditi
FREE
The  Box Range Indicator  for MT5 helps traders visualize key price zones by automatically detecting and highlighting market structures. It dynamically draws upper, lower, and middle levels based on price action, making it an effective tool for identifying  support and resistance zones, breakouts, and trend reversals . Key Features: • Automatic Box Detection – Identifies price ranges based on market movements. • Dynamic High and Low Updates – Adjusts in real time to reflect market conditions.
FREE
The  Zero Lag Least Squares Moving Average (ZLSMA)  is an advanced moving average indicator designed to provide  fast and smooth trend analysis  while eliminating lag. It is based on the  Least Squares Moving Average (LSMA)  but incorporates a zero-lag calculation, making it highly responsive to price changes. This indicator helps traders identify trend direction with minimal delay, making it ideal for both short-term and long-term trading strategies. Key Features: • Zero-Lag Calculation – Red
FREE
The  ATR Finder  indicator for MT5 is a powerful tool designed to help traders analyze market volatility using the  Average True Range (ATR) . This indicator calculates and displays ATR values dynamically, allowing traders to identify periods of high and low volatility, optimize stop-loss and take-profit levels, and refine their trading strategies. Key Features: • Real-time ATR Calculation – Continuously updates ATR values to reflect current market conditions. • Customizable Settings – Adjust
FREE
The ATR Indicator Based on Heiken Ashi is a unique volatility analysis tool that combines the Average True Range (ATR) with Heiken Ashi candlestick calculations to provide a smoother and more reliable measure of market volatility. Unlike the traditional ATR, which uses standard candlesticks, this indicator applies the Heiken Ashi formula to filter out market noise and deliver a clearer volatility signal. Key Features: • ATR Calculation Based on Heiken Ashi Candlesticks – Offers a more stable v
FREE
The   MAAOS Expert Advisor   is a powerful automated trading system that combines   Moving Averages (MA)   and the   Andean Oscillator (AO)   to generate high-probability trading signals. By leveraging these two indicators, MAAOS identifies trend directions and momentum shifts with precision, allowing traders to enter and exit trades at optimal points. Key Features: •   Dual Indicator Strategy   – Uses Moving Averages to determine the overall trend and the Andean Oscillator to confirm entry an
The Dual MACD & Stochastic Expert Advisor (EA)  is a fully automated trading system that utilizes two  MACD (Moving Average Convergence Divergence) indicators along with the  Stochastic Oscillator  to identify high-probability trading opportunities. By combining trend confirmation from MACD with momentum analysis from Stochastic, this EA provides precise entry and exit points for optimized trading performance. Key Features: • Dual MACD Strategy – Uses two MACD indicators with different setting
The  Momentum & EMA Expert Advisor (EA)  is a fully automated trading system that combines  two Momentum indicators  with  Exponential Moving Averages (EMA)  to identify high-probability trade opportunities. This EA leverages momentum strength and trend confirmation to execute precise entries and exits. Key Features: • Dual Momentum Strategy – Uses two Momentum indicators with different periods to confirm price acceleration. • EMA Trend Confirmation – Trades are opened only when the EMAs align
The  Triple MACD Scalping EA  is a fully automated trading system designed for high-frequency scalping. It utilizes three different  MACD indicators  with varying settings to confirm strong market momentum and optimize entry and exit points. This strategy is ideal for short-term traders looking for quick profits in volatile market conditions. Key Features: • Triple MACD Confirmation – Uses three MACDs with different periods to filter false signals and confirm strong trends. • High-Frequency Sc
This strategy combines  three Moving Averages (MAs)  with  Williams Fractals  to identify strong trends and optimal trade entry points. It is designed for traders looking for a simple yet effective approach to follow market trends and capture profitable opportunities. How It Works: • Three Moving Averages (fast, medium, and slow) help determine the overall trend direction. • Williams Fractals identify local highs and lows, signaling potential reversals or trade entries. • Trade Entry occurs wh
This strategy integrates the   Average Force Indicator ,   Andean Oscillator , and   MACD   to identify strong trends, momentum shifts, and optimal trade entry points. It is designed for traders who seek a balanced approach between trend-following and momentum trading. How It Works: •   Average Force Indicator   measures market strength, filtering out weak trends and confirming strong movements. •   Andean Oscillator   identifies momentum shifts and trend continuation signals. •   MACD (Moving
This strategy is designed for  high-frequency scalping , utilizing the  Daily High/Low  levels and the  Andean Oscillator  to identify optimal trade opportunities. It works best in volatile market conditions where price frequently reacts to key levels. How It Works: • Daily High/Low Levels act as dynamic support and resistance zones where price often consolidates or reverses. • Andean Oscillator measures momentum shifts and trend strength, confirming entries with high precision. • Trade Entry:
This strategy combines Linear Regression Candles with UT Bot Alerts to identify high-probability trading opportunities. It is designed for trend-following and breakout trading , making it suitable for multiple timeframes and market conditions. How It Works: • Linear Regression Candles smooth out price action, providing a clear visualization of the trend and reducing market noise. • UT Bot Alerts generate precise entry and exit signals by detecting strong momentum shifts. • Trade Entry: • Buy:
This strategy combines  Bollinger Bands  and the  Relative Strength Index (RSI)  to identify optimal trade opportunities. It is designed for  mean-reversion and trend-following trading , making it effective in various market conditions. How It Works: • Bollinger Bands help determine volatility and overbought/oversold conditions. • RSI  measures momentum and confirms potential reversals. • Trade Entry: • Buy: When the price touches or moves below the lower Bollinger Band, and the RSI is in the
This strategy integrates the  Nadaraya-Watson Envelope , Relative Strength Index (RSI) ,and  ATR Stop Loss Finder to identify high-probability trade setups with dynamic stop-loss placement. It is suitable for both  trend-following and mean-reversion trading styles . How It Works: • Nadaraya-Watson Envelope: A non-parametric regression-based indicator that smooths price action and identifies dynamic support and resistance zones. • RSI: Measures momentum and helps detect overbought/oversold cond
Filtrele:
İnceleme yok
İncelemeye yanıt