please contact me 210zyx@gmail.com if you want a short DEMO version or shorter subscription (like 1 Month for 10 USD)
There already are some good EA's that can draw the FootPrint and Volume Profile, but they are using number of "ticks" as the unit of volume, which is not accurate. One tick sometimes can mean very large or very small volume and they should not be scaled to the same unit.
The innovation of this EA is that it is able to draw the FootPrint and Volume Profile based on real Binance trade volume data (currently for Bitcoin only). Currently, the data source can be chosen from SPOT or FUTURES. I recommend using FUTURES and by default it is using FUTURES.This can be changed by using the EA input parameter.
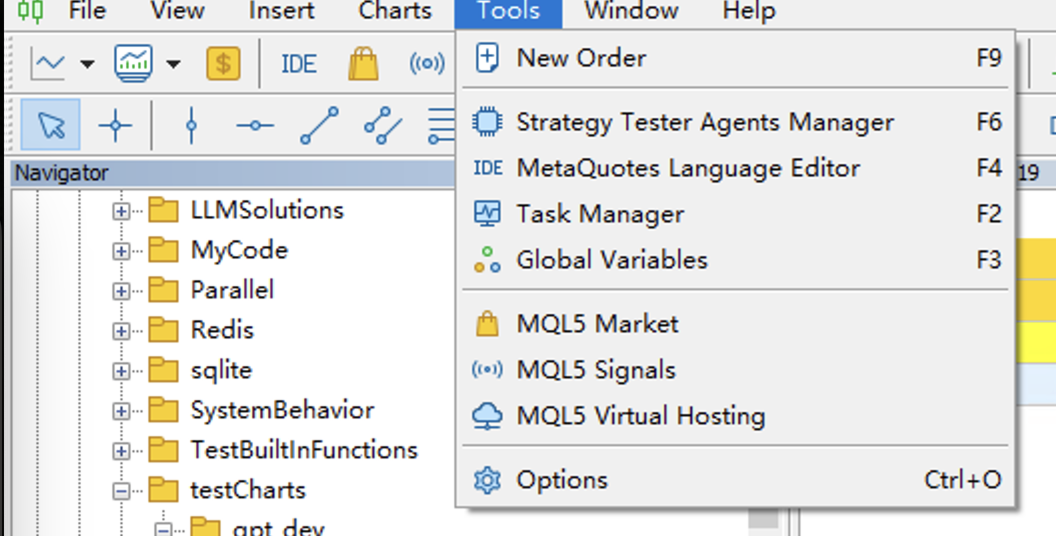
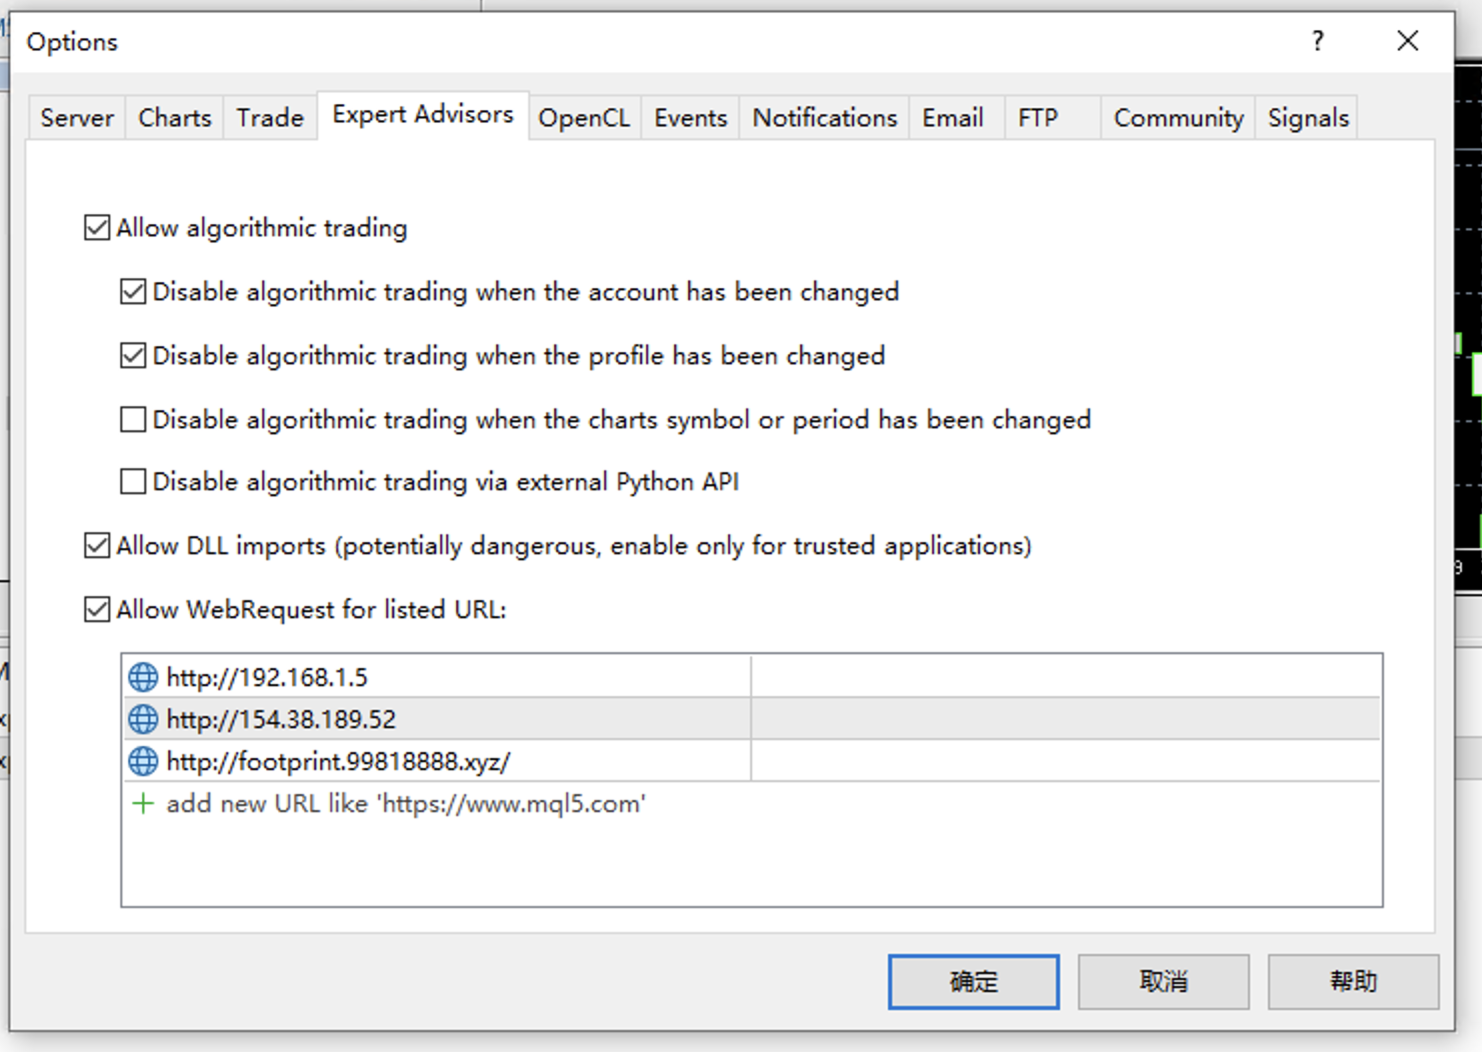
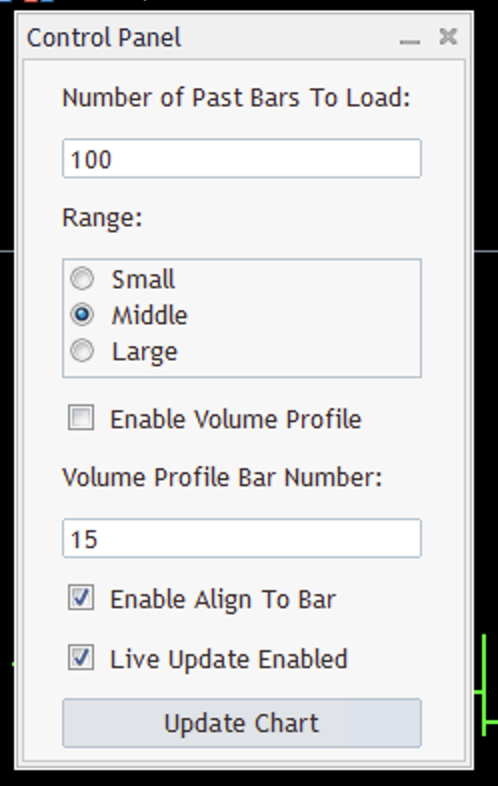
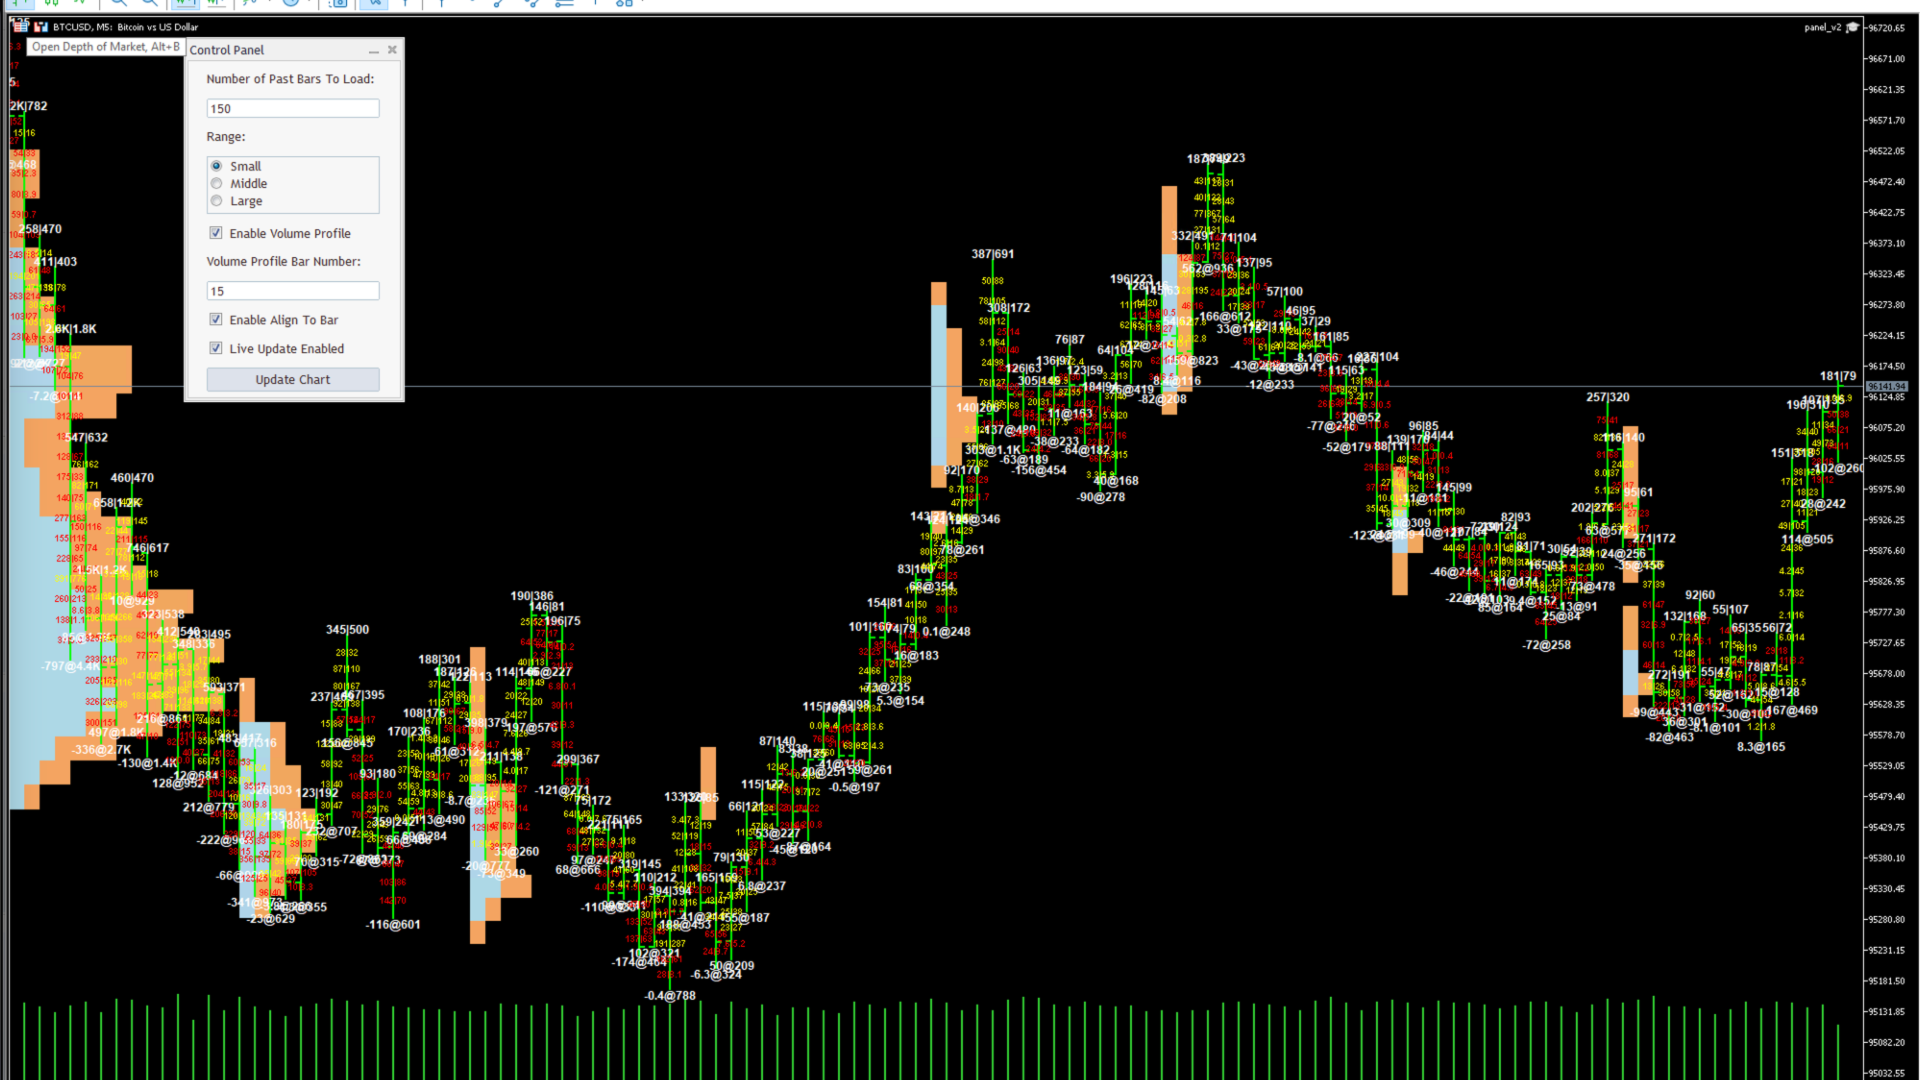
Usage: Load EA to the chart, set the parameters through panel and click "update". Please add "http://footprint.99818888.xyz" to allowed Web Request URL. (like the screenshot does). Unfortunately we have to do this because MQL5 community doesn't allow publish EA which requires DLL. If you want a version that does not require this, please contact me 210zyx@gmail.com.
Supported timeframe: M1, M5, M15, M30, H1
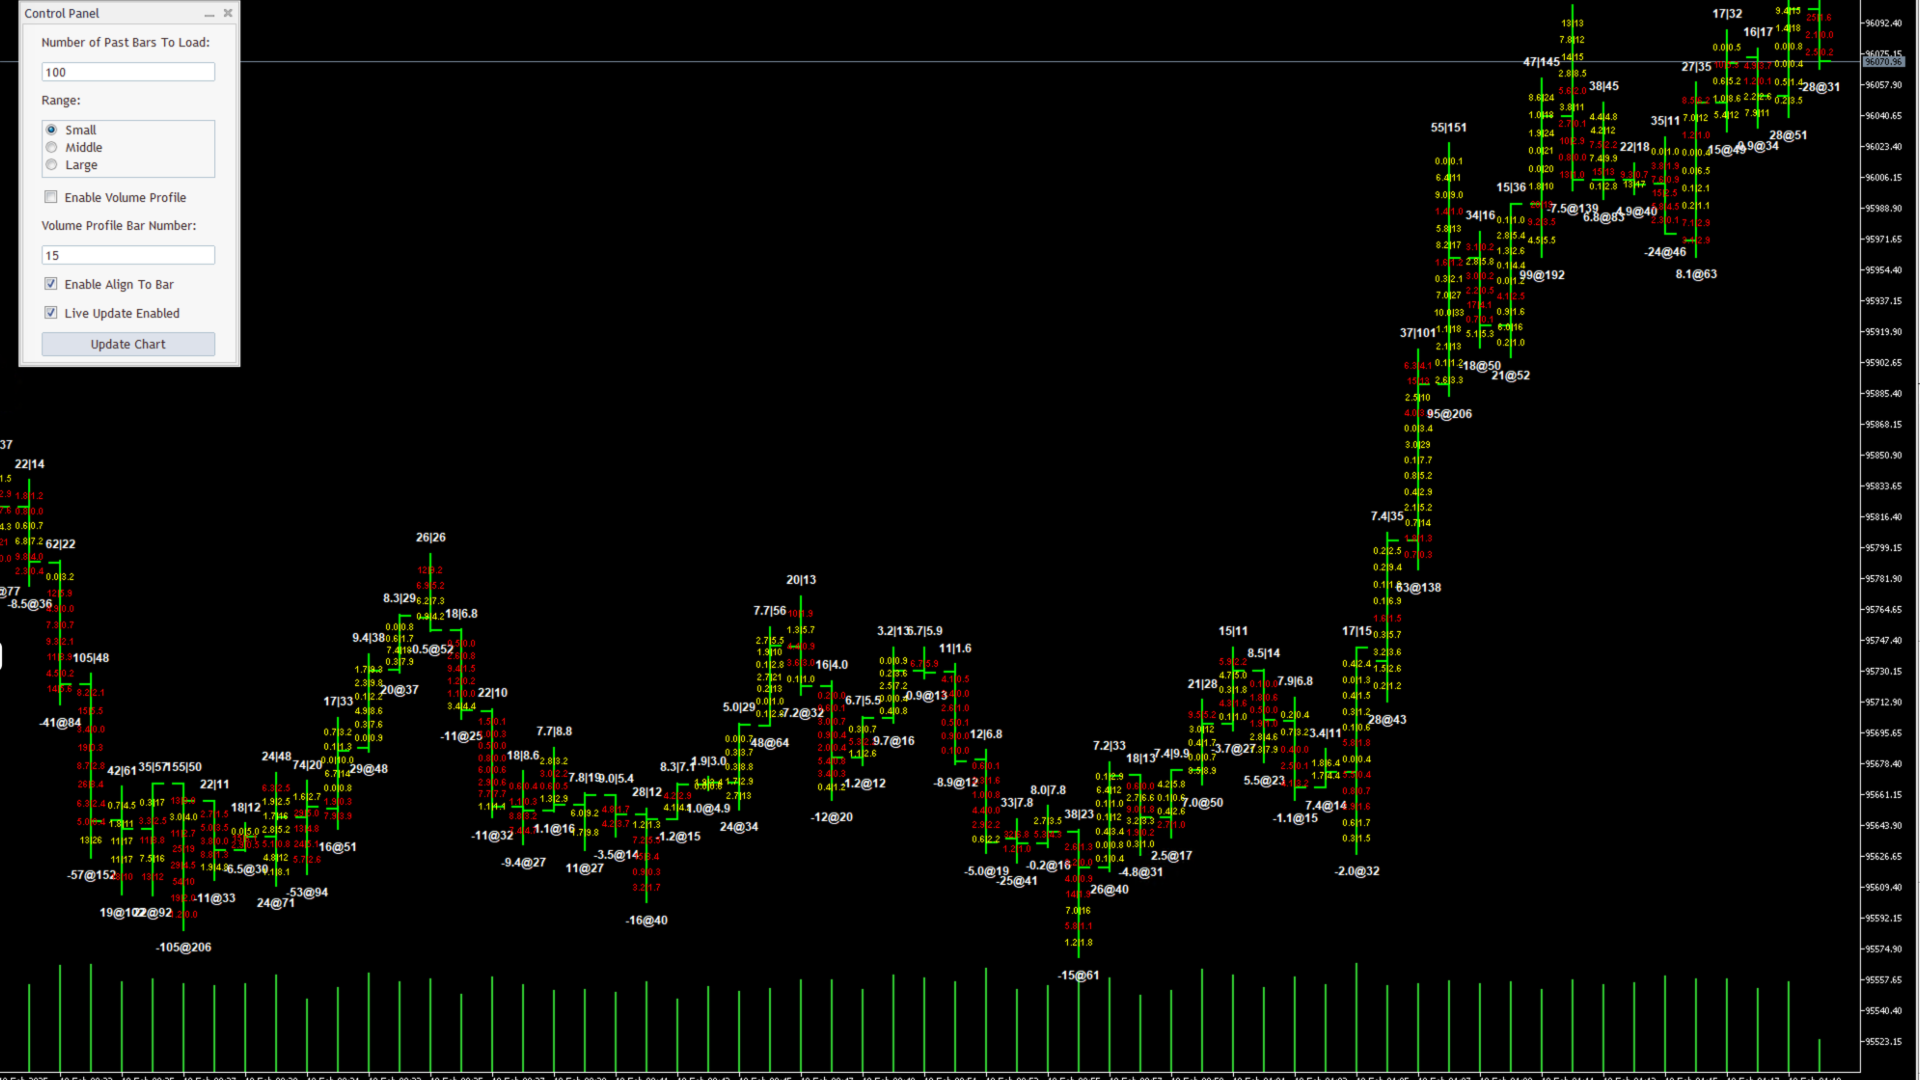
FootPrint:
It is able to draw the FootPrint based on the actual Binance data. Its price could be different from your MT5 price, but if choose to "align to bar", it will align the numbers in the bar to your MT5 bar by scaling and offsetting.
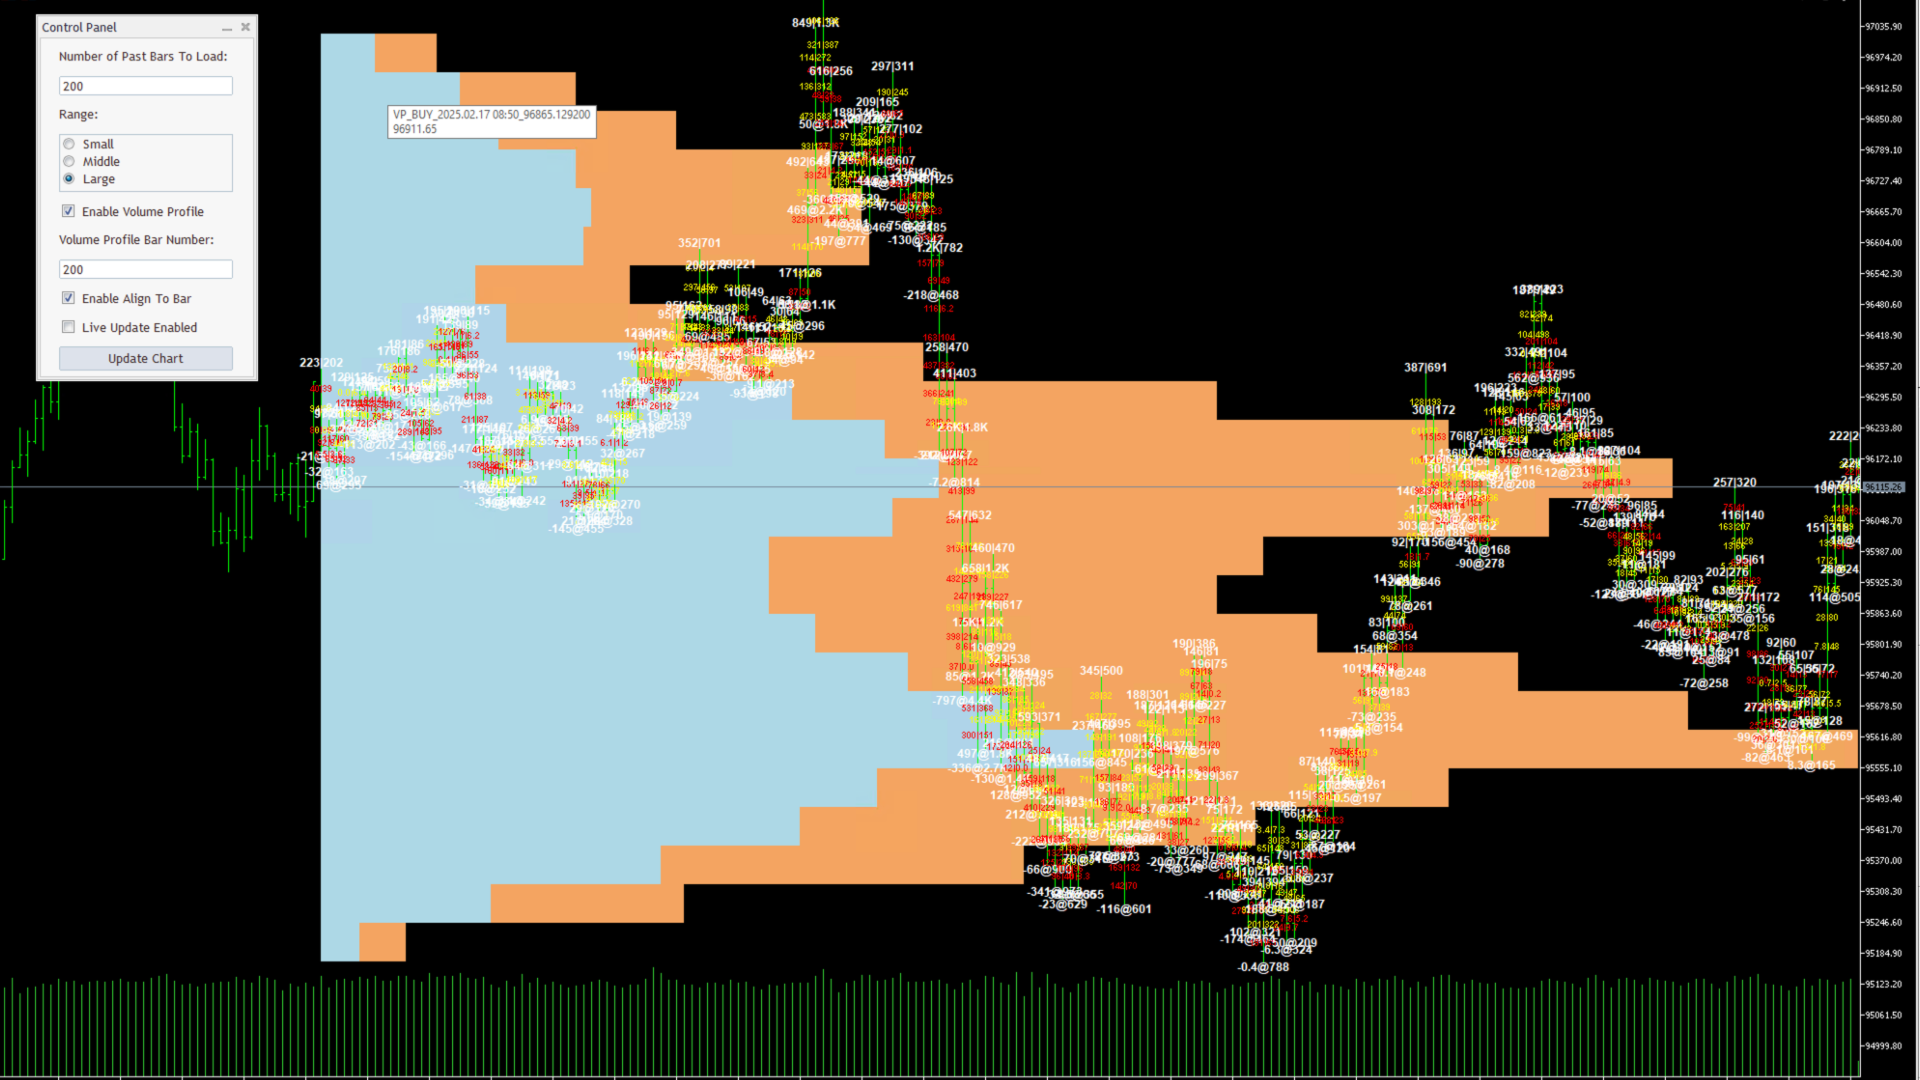
Volume Profile:
You can choose to draw the Volume Profile based on your chosen periods. Say you loaded 150 bars and choose 10 as the period, it will draw 15 volume profiles, each of which show volume provile for 10 bars. Because of the limitation of the MT5, the width of of the rectangle has the minimum resolution of one bar, therefore I choose to scale the larget volume to the periods and other volumes are scaled relative to the largest volume. Of course if you choose 150 as the period, it will draw one volume profile for the whole history selected (150 bars).
Live Update:
By default, if your chart is showing the most recent bar in visible area, the EA will update the numbers bars on the most recent bar automatically, but as soon as you scroll the chart so that the recent bars are not shown, it will stop updating. You can then turn it on again by checking the "Live Update" checkbox and click "update" button.
Check for History:
One can use this with history bars. Just scroll the chart to appropriate area and click "update". A tip for doing this is that you can enter the datetime string in the chart search bar to quickly scroll to the appropriate area.
The MQL5 communicaty won't allow me to set a price lower than $30 per month. You can use $30 three-month option: That is equivalent to $10 per month. Don't hesitate to reach for any issues or feathre request: 210zyx@gmail.com