• Genel bakış
  • İncelemeler (1)
  • Yorumlar (3)
  • Yenilikler

Dual Timeframes

Çift Zaman Çerçevesi Göstergesi – Mum İçinde Mum

Genel Bakış

Mum İçinde Mum Göstergesi, çoklu zaman çerçevesi analiz aracı olup, daha yüksek zaman çerçevesine ait mumları daha düşük zaman çerçevesi grafiği üzerine yerleştirir. Farklı zaman dilimleri arasında geçiş yapmak yerine, yatırımcılar küçük mumların daha büyük mumların içinde nasıl oluştuğunu görebilir. Bu sayede piyasa yapısını, trendleri ve işlem giriş/çıkış noktalarını daha iyi analiz edebilirler.

Bu gösterge, temel (daha düşük) zaman çerçevesini seçip bir çarpan uygulayarak, daha yüksek zaman çerçevesi mumlarının grafik üzerinde dinamik olarak oluşturulmasını sağlar. Böylece yatırımcılar tek bir grafik üzerinde çoklu zaman çerçevesi analizlerini gerçekleştirebilir.

Gösterge Nasıl Çalışır?

  1. Daha Düşük Zaman Çerçevesini Seçin: İlgili zaman dilimindeki grafiği açın (örneğin M1, M5, M10).
  2. Çarpanı Belirleyin: Daha yüksek zaman çerçevesini oluşturmak için bir çarpan belirleyin.
    • Örnek:
      • M1 grafiği + 5x çarpan → M1 mumları, M5 mumları içinde gösterilir.
      • M10 grafiği + 6x çarpan → M10 mumları, H1 mumları içinde gösterilir.
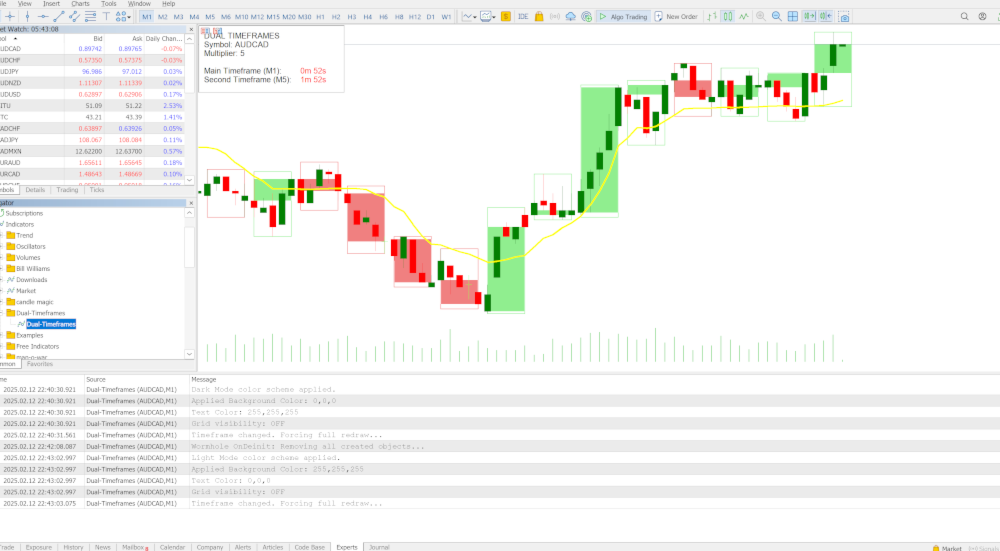
  3. Yüksek Zaman Çerçevesi Mumlarını Görüntüleyin: Gösterge, Açılış (Open), En Yüksek (High), En Düşük (Low), Kapanış (Close) (OHLC) değerlerini gösterir.

Her daha yüksek zaman çerçevesi mumu şu bilgileri içerir:
Dış Kutu (High-Low): Daha büyük zaman dilimindeki mumun en yüksek ve en düşük seviyelerini gösterir.
İç Kutu (Open-Close): Açılış ve kapanış fiyatlarını gösterir.
Gerçek Zamanlı Güncelleme: Son mum, piyasa hareketine göre anlık olarak güncellenir.

Gösterge Nasıl Test Edilir?

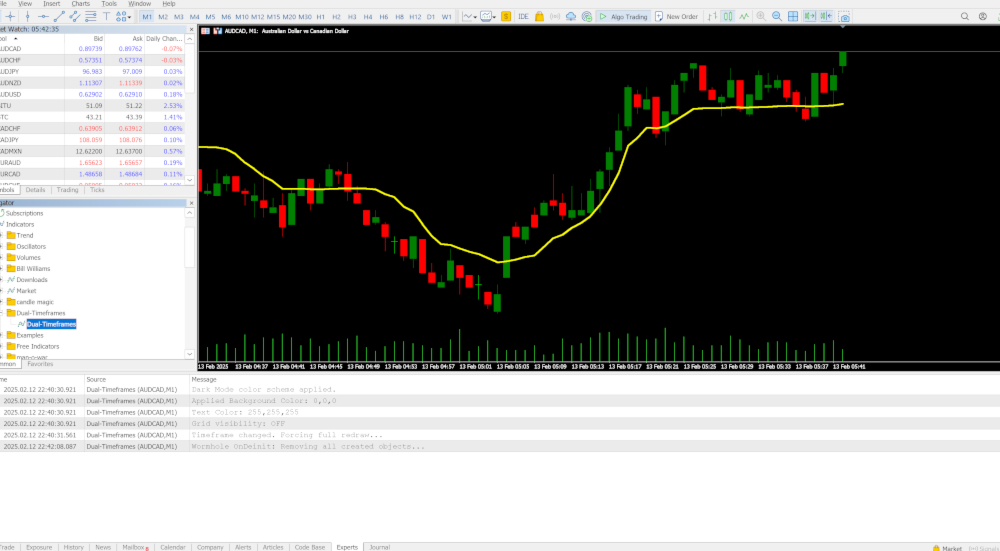
  1. Göstergeyi Grafiğe Uygulayın:

    • M1 grafiğini (veya tercih edilen zaman çerçevesini) açın.
    • Çift Zaman Çerçevesi Göstergesini grafiğe sürükleyip bırakın.
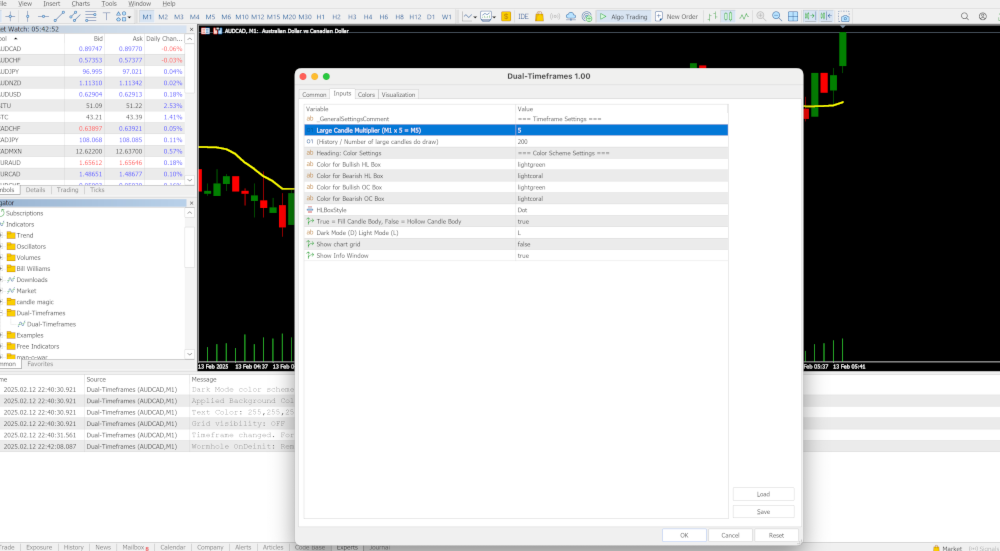
  2. Çarpanı Seçin:

    • Varsayılan çarpan değeri 5’tir.
    • M1 grafiğinde 5 çarpanı kullanıldığında, M1 mumları M5 mumları içinde gösterilecektir.
    • M10 grafiğinde 6 çarpanı kullanıldığında, M10 mumları H1 mumları içinde gösterilecektir.
    • Ayarları uygulamak için OK tuşuna basın.
  3. Göstergeyi İzleyin:

    • Daha düşük zaman çerçevesindeki mumlar, daha yüksek zaman çerçevesindeki mumların içinde hareket eder.
    • Dış kutular en yüksek ve en düşük seviyeleri, iç kutular ise açılış ve kapanış fiyatlarını gösterir.
    • Son mum gerçek zamanlı olarak güncellenir.

Özelleştirme Seçenekleri

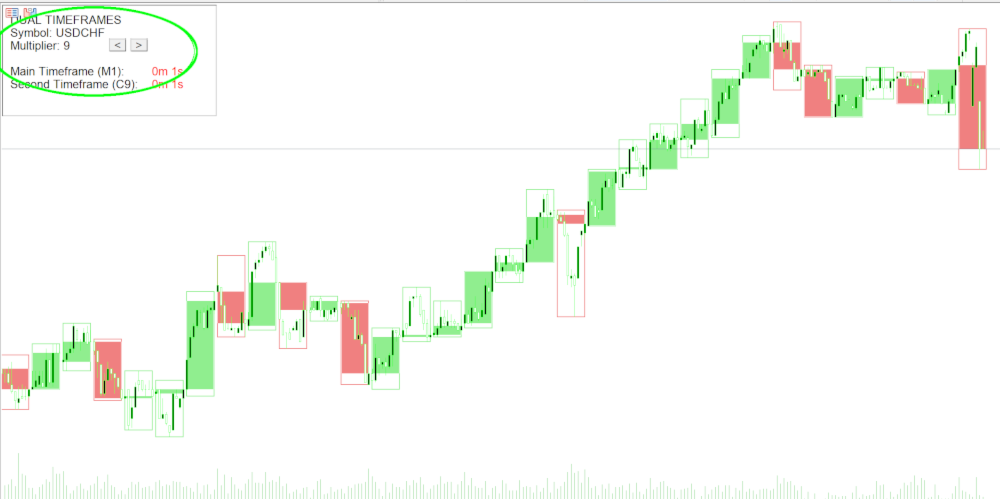
  • Izgara Görünümü: Daha iyi bir görüntüleme deneyimi için ızgarayı açın/kapatın.
  • Bilgi Penceresi: Daha yüksek zaman çerçevesi mumu hakkında ek bilgileri gösterin/gizleyin.
  • Arka Plan Rengi: Daha iyi kontrast için arka plan rengini değiştirin.
  • High-Low Kutu Rengi: Dış kutunun rengini değiştirin.
  • Open-Close Kutu Rengi: İç kutunun rengini değiştirin.

Bu Göstergeyi Neden Kullanmalısınız?

Çoklu Zaman Çerçevesi Analizi – Aynı grafik üzerinde farklı zaman çerçevelerini görüntüleyin.
Daha Hassas Giriş ve Çıkış Noktaları – Daha büyük zaman dilimi seviyelerini kullanarak işlem doğruluğunu artırın.
Grafik Değiştirme Gereksinimini Ortadan Kaldırır – Zaman kazandırır ve analiz sürecini daha basit hale getirir.
Tüm Piyasalarda Kullanılabilir – Forex, endeksler, hisse senetleri, emtialar ve kripto para piyasaları ile uyumludur.

Mum İçinde Mum Göstergesi, kısa vadeli işlemleri uzun vadeli piyasa yapılarıyla birleştirerek daha güvenilir analizler ve ticaret kararları vermenizi sağlayan güçlü bir araçtır.


If you find this useful, follow me and post a review, check out the wormhole indicator >> wormhole time


Önerilen ürünler
The utility draws pivot levels based on a selection from day week month The previous candlestick of the selected timeframe is taken and the values for the levels are calculated using the following formulas: Pivot = (high + close + low) / 3 R1 = ( 2 * Pivot) - low S1 = ( 2 * Pivot) - high R2 = Pivot + (R1 -S1) R3 = high + ( 2 * (Pivot - low)) S2 = Pivot - (R1 - S1) S3 = low - ( 2 * (high - Pivot)); The style and thickness for all lines are adjusted. The colors for the R, Pivot and S lines ar
FREE
Introduction This indicator detects volume spread patterns for buy and sell opportunity. The patterns include demand and supply patterns. You might use each pattern for trading. However, these patterns are best used to detect the demand zone (=accumulation area) and supply zone (=distribution area). Demand pattern indicates generally potential buying opportunity. Supply pattern indicates generally potential selling opportunity. These are the underlying patterns rather than direct price action. T
FREE
This is a buyer and seller aggression indicator that analyzes the shape of each candle and project this data in a histogram form. There are 4 histograms in one. On the front we have two: Upper - Buyer force. Lower - Seller force. At the background we also have two histogram, both with same color. They measure the combined strenght of buyers and sellers. This histograms can be turned off in Input Parameters. It is also possible to have the real or tick volume to help on this force measurement. IN
FREE
Important Lines
Terence Gronowski
4.86 (21)
This indicator displays Pivot-Lines, preday high and low, preday close and the minimum and maximum of the previous hour. You just have to put this single indicator to the chart to have all these important lines, no need to setup many single indicators. Why certain lines are important Preday high and low : These are watched by traders who trade in a daily chart. Very often, if price climbs over or falls under a preday low/high there is an acceleration in buying/selling. It is a breakout out of a
FREE
Weis Waves
Flavio Javier Jarabeck
2.83 (18)
The original author is David Weis, an expert in the Wyckoff Method. The Weis Wave is a modern adaptation of the 1930's Wyckoff Method, another expert in Tape Reading techniques and Chart Analysis. Weis Waves takes market volume and stacks it into waves according to price conditions giving the trader valuable insights about the market conditions. If you want to learn more about this subject you can find tons of videos in YouTube. Just look for "The Wickoff Method", "Weis Wave" and "Volume Spread
FREE
İndikatör   "Haven Key Levels PDH PDL"   trader'ların grafik üzerinde anahtar seviyeleri görselleştirmelerine yardımcı olur. Aşağıdaki seviyeleri otomatik olarak işaretler: DO (Daily Open)   — Günün açılış seviyesi. NYM (New York Midnight)   — New York gece yarısı seviyesi. PDH (Previous Day High)   — Önceki günün en yüksek seviyesi. PDL (Previous Day Low)   — Önceki günün en düşük seviyesi. WO (Weekly Open)   — Haftalık açılış seviyesi. MO (Monthly Open)   — Aylık açılış seviyesi. PWH (Previou
FREE
Are you tired of drawing trendlines every time you're analyzing charts? Or perhaps you would like more consistency in your technical analysis. Then this is for you. This indicator will draw trend lines automatically when dropped on a chart. How it works Works similar to standard deviation channel found on mt4 and mt5. It has 2 parameters: 1. Starting Bar 2. Number of bars for calculation The   starting bar   is the bar which drawing of the trend lines will begin, while the   number of bars for c
FREE
Value Chart Candlesticks
Flavio Javier Jarabeck
4.73 (11)
The idea of a Value Chart indicator was presented in the very good book I read back in 2020 , " Dynamic Trading Indicators: Winning with Value Charts and Price Action Profile ", from the authors Mark Helweg and David Stendahl. The idea is simple and the result is pure genius: Present candlestick Price analysis in a detrended way! HOW TO READ THIS INDICATOR Look for Overbought and Oversold levels. Of course, you will need to test the settings a lot to find the "correct" one for your approach. It
FREE
Cybertrade Keltner Channels - MT5 Created by Chester Keltner, this is a volatility indicator used by technical analysis. It is possible to follow the trend of financial asset prices and generate support and resistance patterns. In addition, envelopes are a way of tracking volatility in order to identify opportunities to buy and sell these assets. It works on periods longer than the period visible on the chart. All values ​​are available in the form of buffers to simplify possible automations.
FREE
LT Donchian Channel
Thiago Duarte
4.83 (6)
Donchian Channel is an indicator created by Richard Donchian. It is formed by taking the highest high and the lowest low of the last specified period in candles. The area between high and low is the channel for the chosen period. Its configuration is simple. It is possible to have the average between the upper and lower lines, plus you have alerts when price hits one side. If you have any questions or find any bugs, please contact me. Enjoy!
FREE
Follow The Line MT5
Oliver Gideon Amofa Appiah
4.52 (29)
This indicator obeys the popular maxim that: "THE TREND IS YOUR FRIEND" It paints a GREEN line for BUY and also paints a RED line for SELL. (you can change the colors). It gives alarms and alerts of all kinds. IT DOES NOT REPAINT and can be used for all currency pairs and timeframes. Yes, as easy and simple as that. Even a newbie can use it to make great and reliable trades. NB: For best results, get my other premium indicators for more powerful and reliable signals. Get them here: https://www.m
FREE
RSI back arrows
Smaylle Rafael Coelho Mariano
The   RSI Back Arrows   indicator is a powerful tool designed for traders who rely on the Relative Strength Index (RSI) to identify potential market reversals. This indicator specifically highlights when the RSI has exited the   oversold   or   overbought   zones, providing clear visual signals to inform trading decisions. Key Features: Visual Cues : The indicator marks arrows on the chart when the RSI crosses back into a neutral zone, making it easy to spot potential entry and exit points. Over
FREE
The indicator highlights the points that a professional trader sees in ordinary indicators. VisualVol visually displays different volatility indicators on a single scale and a common align. Highlights the excess of volume indicators in color. At the same time, Tick and Real Volume, Actual range, ATR, candle size and return (open-close difference) can be displayed. Thanks to VisualVol, you will see the market periods and the right time for different trading operations. This version is intended f
FREE
High Low Open Close
Alexandre Borela
4.98 (41)
Bu projeyi seviyorsanız, 5 yıldız incelemesi bırakın. Bu gösterge açık, yüksek, düşük ve belirtilen fiyatlar için çizer Dönem ve belirli bir zaman bölgesi için ayarlanabilir. Bunlar birçok kurumsal ve profesyonel tarafından görünen önemli seviyelerdir. tüccarlar ve daha fazla olabileceği yerleri bilmeniz için yararlı olabilir Aktif. Mevcut dönemler şunlardır: Önceki gün. Önceki Hafta. Önceki Ay. Previous Quarter. Önceki yıl. Veya: Mevcut gün. Hafta. Şimdi Ay. Şimdiki Mahallesi. Bugün yıl.
FREE
Donchian Pro
Paulo Henrique Faquineli Garcia
5 (3)
The Donchian Channel Channels are among the most popular tools of technical analysis, as they visually convey to the analyst the limits within which most price movement tends to occur. Channel users know that valuable information can be obtained at any time, whether prices are in the central region of a band or close to one of the border lines. One of the best known techniques to explore these concepts is Bollinger Bands. However, John Bollinger was not the only one to research the application
FREE
Girassol Sunflower MT5 Indicator
Saullo De Oliveira Pacheco
4.33 (6)
This is the famous Sunflower indicator for Metatrader5. This indicator marks possible tops and bottoms on price charts. The indicator identifies tops and bottoms in the asset's price history, keep in mind that the current sunflower of the last candle repaints, as it is not possible to identify a top until the market reverses and it is also not possible to identify a bottom without the market stop falling and start rising. If you are looking for a professional programmer for Metatrader5, please
FREE
Free automatic Fibonacci is an indicator that automatically plots a Fibonacci retracement based on the number of bars you select on the BarsToScan setting in the indicator. The Fibonacci is automatically updated in real time as new highest and lowest values appears amongst the selected bars. You can select which level values to be displayed in the indicator settings. You can also select the color of the levels thus enabling the trader to be able to attach the indicator several times with differe
FREE
Rainbow MT5
Jamal El Alama
4 (1)
Description : Rainbow MT5 is a technical indicator based on Moving Average with period 34 and very easy to use. When price crosses above MA and MA changes color to green, then this is a signal to buy. When price crosses below MA and MA changes color to red, then this is a signal to sell. The Expert advisor ( Rainbow EA MT5 ) based on Rainbow MT5 indicator is now available here . MT4 version is available here .
FREE
Gösterge   Haven FVG   , piyasaları analiz etmek için bir araçtır ve grafikte verimsizlik alanlarını (Fair Value Gaps, FVG) tanımlamanıza olanak tanır, böylece tüccarlara fiyat analizi ve ticari kararlar almak için anahtar seviyeler sağlar. Diğer ürünler ->  BURADA Ana Özellikler: Bireysel renk ayarları: Alış FVG rengi   (Bullish FVG Color). Satış FVG rengi   (Bearish FVG Color). Esnek FVG görselleştirme: FVG aramak için maksimum mum sayısı. FVG bölgelerinin belirli bir bar sayısı kadar ek uzat
FREE
Easy Trade Panel Expert for MT5 The Easy Trade Panel is a specialized tool designed for risk control and capital allocation in trading. This expert includes two sections: the first focuses on order execution, position sizing, and risk-reward configuration, while the second is dedicated to trade management. Features and Specifications of Easy Trade Panel Expert Below is a table detailing the capabilities of the Easy Trade Panel Expert: Category Capital Management - Risk Management - Trading Uti
FREE
Bounce Zone MT5
Nguyen Thanh Cong
4.43 (7)
Introduction The Bounce Zone indicator is a cutting-edge non-repainting technical tool built to identify key areas on the price chart where market sentiment is likely to cause a significant price reversal. Using advanced algorithms and historical price data analysis, this indicator pinpoints potential bounce zones. Combined with other entry signal, this indicator can help forex traders place the best trades possible Signal A possible buy signal is generated when price is in the green zone an
FREE
Pivot Point Fibo RSJ, Fibonacci oranlarını kullanarak günün destek ve direnç çizgilerini izleyen bir göstergedir. Bu muhteşem gösterge, Fibonacci oranlarını kullanarak Pivot Point üzerinden 7 seviyeye kadar destek ve direnç oluşturur. Fiyatların, bir operasyonun olası giriş/çıkış noktalarını algılamanın mümkün olduğu bu destek ve direncin her bir düzeyine uyması harika. Özellikleri 7 seviyeye kadar destek ve 7 seviye direnç Seviyelerin renklerini ayrı ayrı ayarlayın Girişler Pivot Tipi Pivo
FREE
Trend Yakalayıcı: Alarm İndikatörü ile Trend Yakalayıcı Stratejisi, piyasa trendlerini ve potansiyel giriş ve çıkış noktalarını belirlemede yardımcı olan çok yönlü bir teknik analiz aracıdır. Piyasa koşullarına uyum sağlayarak trend yönünün net görsel temsili için dinamik bir Trend Yakalayıcı Stratejisi sunar. Tüccarlar tercihlerine ve risk toleranslarına göre parametreleri özelleştirebilirler. Gösterge, trendleri tanımlamaya yardımcı olur, potansiyel ters dönüşleri sinyaller, trailing stop me
FREE
Expansoes M
Marcus Vinicius Da Silva Miranda
The M Extensions are variations of the Golden Ratio (Fibonacci Sequence). It is the World's first technique developed for Candle Projections. Advantages: Easy to plot. Candle anchoring; High and accurate precision as support and resistance; Excellent Risk x Return ratio; Works in any timeframe; Works in any asset / market.   The M Extensions are classified into: M0: Zero point (starting candle) RC: Initial candle control region M1: Extension region 1 M2: Extension region 2 M3: Extension regi
FREE
The Rayol Code Hour Interval Lines indicator was  designed to assist your trading experience.  It  draws the range of hours chosen by the user directly on the chart, so that it enables traders to visualize price movements during their preferred trading hours, providing  traders a more comprehensive view of price movements and market dynamics. This indicator allows the user to choose not only the Broker's time, but also the Local time. This way, the user no longer needs to calculate local time in
FREE
A Renko Tick chart based on continuously adjusting percentage. Live Renko bricks formed by tick data Adjustable brick width expert for indicator attached Scalp with a Renko, get weird. The settings can and will break the script if you turn them up too high. Turning off outline mode will not look as nice, but can potentially allow for a larger number of bricks.
FREE
Functional in the Forex market. Functional in the B3 market - Bolsa Brasil Balcão. Motivation The technical Fibonacci retraction indicator for many is essential and the basis for all market movement forecasts. The name of the tool comes from the Italian mathematician Leonardo de Pisa (13th century). This DEMO version will work in Meta Trader with Demo and Strategy Tester. To purchase the Full version that works on a Real account, click on: https://www.mql5.com/en/market/product/38089 Opera
FREE
The one minute chart has a bug, but the one-day chart can still be used after deleting the bug and reloading the indicators, This indicator can be used to determine how far the indicator goes up to place an order to buy, how far it goes down to place an order to sell, and not placing an order until it reaches this distance, which is considered oscillation, open an account gift index
FREE
Best SAR MT5
Ashkan Hazegh Nikrou
4.33 (3)
Acıklama:  Forex piyasasında (PSAR) Profesyonel ve populate göstergelerden Birine Dayanan Yeni ücretsiz göstergemizi tanıtmaktan mutluluk duyuyoruz (PSAR) drank gösterge orijinal Parabolik SAR göstergesinde Yeni bir değişikliktir pro SAR göstergesinde noktalar ve Fiyat tablosu arasındaki geçişi görebilirsiniz, drank crossover bir sinyal değil, hareketin sonu potansiyeli hakkında konuşun, yeni mavi nokta ile satın almaya başlayabilir ve ilk mavi noktadan bir atr önce stop loss koyabilirsiniz ve
FREE
Tops and Bottoms Indicator
Josue De Matos Silva
4.67 (6)
Tops & Bottoms Indicator FREE   Tops abd Bottoms:   An effective indicator for your trades The tops and bottoms indicator helps you to find  ascending and descending channel formations with indications of ascending and/or descending tops and bottoms. In addition, it  show possibles  opportunities with a small yellow circle when the indicator encounters an impulse formation. This indicator provide to you  more security and speed in making entry decisions. Also test our FREE advisor indicator:  
FREE
Bu ürünün alıcıları ayrıca şunları da satın alıyor
Trade Assistant MT5
Evgeniy Kravchenko
4.41 (173)
It helps to calculate the risk per trade, the easy installation of a new order, order management with partial closing functions, trailing stop of 7 types and other useful functions. Additional materials and instructions Installation instructions - Application instructions - Trial version of the application for a demo account Line function -   shows on the chart the Opening line, Stop Loss, Take Profit. With this function it is easy to set a new order and see its additional characteristics bef
Trade Manager EA’ye hoş geldiniz! Ticaretin daha sezgisel, hassas ve verimli hale gelmesi için tasarlanmış nihai risk yönetim aracı ile tanışın. Bu sadece bir emir verme aracı değil; ticaret planlaması, pozisyon yönetimi ve risk kontrolü için kapsamlı bir çözüm. İster yeni başlayan bir yatırımcı olun, ister deneyimli bir trader ya da hızlı emir gerektiren bir scalper, Trade Manager EA ihtiyaçlarınıza uyum sağlar ve forex, endeksler, emtialar ve kripto paralar dahil tüm piyasalarda esneklik sunar
TradePanel MT5
Alfiya Fazylova
4.85 (125)
Ticaret Paneli çok işlevli bir ticaret asistanıdır. Uygulama, manuel ticaret için 50'den fazla ticaret işlevi içerir ve çoğu ticaret işlemini otomatikleştirmenize olanak tanır. Dikkat, uygulama strateji test cihazında çalışmıyor. Satın almadan önce demo sürümünü bir demo hesabında test edebilirsiniz. Demo sürümü burada . Talimatların tamamı buraya . Ticaret. Tek tıklamayla alım satım işlemlerini gerçekleştirmenizi sağlar: Otomatik risk hesaplaması ile bekleyen emir ve pozisyonları açın. Tek tıkl
Local Trade Copier EA MT5
Juvenille Emperor Limited
4.98 (81)
Local Trade Copier EA MT5   ile olağanüstü hızlı işlem kopyalama deneyimi yaşayın. Kolay 1 dakikalık kurulumuyla bu işlem kopyalayıcısı, aynı Windows bilgisayarda veya Windows VPS'te birden fazla MetaTrader terminali arasında işlemleri kopyalamanıza olanak tanır ve 0.5 saniyenin altındaki şimşek hızında kopyalama hızları sunar. Başlangıç seviyesinde veya profesyonel bir tüccar olsanız da,   Local Trade Copier EA MT5 , spesifik ihtiyaçlarınıza göre özelleştirmek için geniş bir seçenek yelpazesi s
Tired of complex order placement and manual calculations? Trade Dashboard is your solution. With its user-friendly interface, placing orders becomes effortless, by a single click, you can open trades, set stop loss and take profit levels, manage trade lot size, and calculate risk to reward ratios, allowing you to only focus on your strategy. Say goodbye to manual calculations and streamline your trading experience with Trade Dashboard. Download  Demo Version  right now. You can find  Details of
The product will copy all telegram signal to MT5 ( which you are member) , also it can work as remote copier.  Easy to set up, copy order instant, can work with almost signal formats, image signal,  s upport to translate other language to English Work with all type of channel or group, even channel have "Restrict Saving Content", work with  multi channel, multi MT5 Work as remote copier: with signal have ticket number, it will copy exactly via ticket number. Support to backtest signal. How to s
Üye olduğunuz herhangi bir kanaldan (özel ve kısıtlı olanlar dahil) sinyalleri doğrudan MT5'inize kopyalayın.  Bu araç, kullanıcıyı göz önünde bulundurarak tasarlanmış olup işlemleri yönetmek ve izlemek için ihtiyacınız olan birçok özelliği sunar. Bu ürün, kullanıcı dostu ve görsel olarak çekici bir arayüzde sunulmaktadır. Ayarlarınızı özelleştirin ve ürünü dakikalar içinde kullanmaya başlayın! Kullanıcı Kılavuzu + Demo  | MT4 Sürümü | Discord Sürümü Demo denemek isterseniz lütfen kullanıcı kı
MT5 to Telegram Signal Provider , hesabınızı bir sinyal sağlayıcı haline getirerek belirtilen sinyalleri Telegram'ın sohbetine, kanalına veya grubuna göndermeyi sağlayan kullanımı kolay, tamamen özelleştirilebilir bir araçtır. Rakip ürünlerin çoğunun aksine, DLL içe aktarması yapmaz. [ Demo ] [ Kılavuz ] [ MT4 Versiyonu ] [ Discord Versiyonu ] [ Telegram Kanalı ] Kurulum Adım adım bir kullanıcı kılavuzu mevcuttur. Telegram API'si hakkında bilgi gerekmemektedir; ihtiyacınız olan her şey geliştir
Riskinizi otomatik olarak hesaplarken işlemlere hızlı bir şekilde girip çıkmanıza yardımcı olacak Ticaret Yöneticisi. Aşırı Ticaret, İntikam Ticareti ve Duygusal Ticaretten korunmanıza yardımcı olacak özellikler içerir. İşlemler otomatik olarak yönetilebilir ve hesap performans ölçümleri bir grafikte görselleştirilebilir. Bu özellikler, bu paneli tüm manuel yatırımcılar için ideal kılar ve MetaTrader 5 platformunun geliştirilmesine yardımcı olur. Çoklu Dil desteği. MT4 Sürümü  |  Kullanım Kılavu
Custom Alerts: Birden Fazla Piyasayı İzleyin ve Hiçbir Önemli Fırsatı Kaçırmayın Genel Bakış Custom Alerts , birden fazla enstrümandaki potansiyel setupları merkezi bir şekilde takip etmek isteyen traderlar için dinamik bir çözümdür. FX Power, FX Volume ve IX Power gibi önde gelen araçlarımızın verilerini bütünleştirerek Custom Alerts , birden fazla grafikle uğraşmadan veya kritik fırsatları kaçırma riskine girmeden, piyasadaki önemli değişiklikleri otomatik olarak size bildirir. Daha akıllı v
2025 happy new year -25% discount ($199 -> $149) Advanced trading tool: One click smart orders that execute under your conditions Developed by trader for trading community:  position size calculator (lot size), open position after price action, strategy builder, set and forget trading, mobile notifications... Risk Management -  Risk percentage position size calculator, gain percentage, target risk reward ratio, spread and commissions are included in calculations 7 Advanced order types  - Set a
Trade copier MT5
Alfiya Fazylova
4.48 (27)
Trade Copier, ticaret hesapları arasındaki işlemleri kopyalamak ve senkronize etmek için tasarlanmış profesyonel bir yardımcı programdır. Kopyalama, tedarikçinin hesabından/terminalinden alıcının aynı bilgisayarda veya vps'de kurulu olan hesabına/terminaline gerçekleşir. Satın almadan önce demo sürümünü bir demo hesabında test edebilirsiniz. Demo versiyonu burada . Tüm talimatlar burada . Ana işlevler ve avantajlar: Emirlerin kopyalanmasını destekler: МТ5> МТ5, МТ4> МТ5, МТ5> МТ4. Emirlerin kopy
MT5 için ticari kopyalayıcı, МetaТrader 5 platformu için bir ticari kopyalayıcıdır   . arasındaki   forex işlemlerini kopyalar.       COPYLOT MT5 sürümü için   herhangi bir hesap   MT5   -   MT5, MT4   -   MT5 (veya COPYLOT MT4 sürümü için   MT4 -   MT4 MT5   -  MT4) Güvenilir fotokopi makinesi! MT4 sürümü Tam tanım   +DEMO +PDF Nasıl alınır Nasıl kurulur     Günlük Dosyaları nasıl alınır?     Nasıl Test Edilir ve Optimize Edilir     Expforex'in tüm ürünleri Ayrıca МТ4 terminali   (МТ4   -  
Grid Manual MT5
Alfiya Fazylova
4.76 (17)
Grid Manual, sipariş ızgarasıyla çalışmak için kullanılan bir ticaret yardımcı programıdır. Yardımcı program evrenseldir, esnek ayarlara ve sezgisel bir arayüze sahiptir. Sadece kayıpların ortalaması yönünde değil, aynı zamanda kazanç artışı yönünde de bir emir ızgarası ile çalışır. Tüccarın bir emir ızgarası oluşturmasına ve eşlik etmesine gerek yoktur, bu yardımcı programı yapacaktır. Emri açmanız yeterlidir ve Grid manual otomatik olarak ona bir emir ızgarası oluşturacak ve kapanana kadar ona
B e sure to watch this video before using A community for users, product discussion, update news, and first line of support  Use Webmoney For payments in cryptocurrencies. How I use this algo tool   Lazy Trader is NOT SUITABLE FOR SCALPING EVERY MINUTE MOVEMENT, ESPECIALLY IN CRYPTO. WITHOUT UNDERSTANDING WHAT IS HAPPENING ON THE CHART, THERE IS NO POINT IN BLINDLY HOPING FOR PROFITS! Lazy Trader does NOT USE openAI chat-gpt-4 technologies, which are added to descriptions for product promotion
-25% discount ($149 -> $111) Everything for chart Technical Analysis indicator mt5 in one tool Draw your supply demand zone with rectangle and support resistance with trendline and get alerts to mobile phone or email alert -  Risk reward indicator mt5 Video tutorials, manuals, DEMO download   here .   Find contacts on my   profile . 1.   Extended rectangles and trendlines Object will be extended to the right edge of the chart when price will draw new candles on chart. This is rectangle extende
OrderManager 'ı Tanıtıyoruz: MT5 için Devrim Niteliğinde Bir Yardımcı Program Yepyeni Order Manager yardımcı programı ile MetaTrader 5 için işlemlerinizi bir profesyonel gibi yönetin. Basitlik ve kullanım kolaylığı göz önünde bulundurularak tasarlanmış olan Order Manager, her işlemle ilişkilendirilen riski kolayca tanımlamanıza ve görselleştirmenize olanak tanır, böylece bilinçli kararlar alabilir ve ticaret stratejinizi optimize edebilirsiniz. OrderManager hakkında daha fazla bilgi için lütfen
Cerberus Equity Watcher
Samuel Bandi Roccatello
5 (3)
Cerberus the Equity Watcher , hesap öz sermayenizi sürekli olarak izleyen ve hatalı EA'ların veya isteğe bağlı bir tüccarsanız duygusal davranışınızın neden olduğu büyük düşüşlerden kaçınan bir risk yönetimi aracıdır. Hatalar içerebilecek veya beklenmedik piyasa koşullarında iyi performans göstermeyebilecek EA'lara güvenen sistematik tüccarlar için son derece yararlıdır. Cerberus, bir minimum öz sermaye değeri ve (isteğe bağlı olarak) bir maksimum değer belirlemenize izin verir, bunlardan herhan
KT Equity Protector MT5
KEENBASE SOFTWARE SOLUTIONS
4.5 (2)
KT Equity Protector EA consistently monitors the account equity and closes all the market and pending orders once the account equity reached a fixed equity stop loss or profit target.  After closing all trading positions, the EA can close all open charts to stop other expert advisors from opening more trading positions. Equity Stop-Loss If your current account balance is $5000 and you set an equity stop loss at $500. In this case, the KT Equity Protector will close all the active and pending or
The  Easy Strategy Builder (ESB)  is a " Do It Yourself " solution that allows you to create a wide range of the automated trading strategies without any line of codes. This is the world’s easiest method to automate your strategies that can be used in STP, ECN and FIFO brokers. No drag and drop is needed. Just by set conditions of your trading strategy and change settings on desired values and let it work in your account. ESB has hundreds of modules to define unlimited possibilities of strategi
YuClusters
Yury Kulikov
4.93 (41)
Attention: You can view the program operation in the free version  YuClusters DEMO .  YuClusters is a professional market analysis system. The trader has unique opportunities to analyze the flow of orders, trade volumes, price movements using various charts, profiles, indicators, and graphical objects. YuClusters operates on data based on Time&Sales or ticks information, depending on what is available in the quotes of a financial instrument. YuClusters allows you to build graphs by combining da
Anında gün ve hafta bazında kapalı işlem geçmişinizi, mevcut açık işlemlerinizi ve döviz maruziyetinizi tek bir grafikte görün! Karlı işlemleri ve mevcut düşüşünüzün işlem portföyünüzde nerede olduğunu belirlemek için ısı haritasını kullanın. Hızlı Kapatma Düğmeleri Hızlı kapatma düğmelerini kullanarak tek bir semboldeki her işlemi kapatın, tek tek işlemleri tamamen kapatın veya bir düğmeye tıklayarak kısmi kar veya zarar elde edin. Artık bir listede işlem aramanıza ve işlemlerinizin bir kısmı
Trader Evolution
Siarhei Vashchylka
5 (5)
" Trader Evolution " - A utility designed for traders who use wave and technical analysis in their work. One tab of the utility is capable of money management and opening orders, and the other can help in making Elliott wave and technical analysis. Manual (Be sure to read before purchasing) | Version for MT4 Advantages 1. Trading in a few clicks. Immediate and pending orders are available in the panel 2. Money management. The program automatically selects the appropriate lot size 3. Simplifies
Trade Manager EA for MT5
Odaine Ramon Mcmillan
4.46 (13)
50% Off Today Only! Price Goes Back Up at 11 PM (EST) Marketkeys Trade Manager EA for MT5: Your Pathway to Forex Trading Mastery What Traders Are Saying: "Much better than lots of other trade managers I've tested..." – R Vdr "Saves me time from manually calculating lots sizes and risks...amazing support." – Richard Obi Efficiency and precision are paramount in Forex trading. Marketkeys Trade Manager EA for MT5 offers just that - a seamless interface combined with robust risk management tools.
The most advanced news filter on MQL market - free demo available Take a Break has transformed from a basic news filter into a comprehensive account protection solution. It seamlessly pauses any other Expert Advisors during news events or based on your custom filters, all while safeguarding your EA settings - restoring them automatically when trading resumes for complete peace of mind. Typical use cases: A single news filter for all your EAs. Stop trading during news/high volatility (+ close all
1 tıklama ile ticaret için Ticaret Paneli.   Pozisyonlar ve emirlerle çalışmak!   Grafikten veya klavyeden alım satım. Alım satım panelimizi kullanarak, grafikten tek bir tıklamayla alım satım yapabilir ve alım satım işlemlerini standart MetaTrader kontrolünden 30 kat daha hızlı gerçekleştirebilirsiniz. Bir tüccar için hayatı kolaylaştıran ve bir tüccarın ticaret faaliyetlerini çok daha hızlı ve daha rahat gerçekleştirmesine yardımcı olan parametrelerin ve işlevlerin otomatik hesaplamaları. Graf
Bu ürün, haber saatlerinde tüm uzman danışmanları ve manüel grafikleri filtreler, böylece manüel ticaret kurulumlarınızı veya diğer uzman danışmanlar tarafından girilen işlemleri yok edebilecek ani fiyat dalgalanmaları konusunda endişelenmenize gerek kalmaz. Bu ürün, herhangi bir haber yayınlanmadan önce açık pozisyonlarınızı ve bekleyen emirlerinizi yönetebilen tam bir sipariş yönetim sistemi ile birlikte gelir.   The News Filter'ı   satın aldığınızda, gelecekteki uzman danışmanlar için yerleşi
Haber Olayı İçgörüleriyle İşlemlerinizi Geliştirin Hızlı tempolu işlem dünyasında, haber olayları piyasa fiyatlarını önemli ölçüde etkileyebilir. Bu olayların fiyat hareketlerini nasıl etkilediğini anlamak, volatil dönemlerde işlemlerinizi yönetmek için kritik önem taşır. News Tool EA, hem geçmiş hem de yaklaşan haber olaylarına dair içgörüler sağlamak üzere tasarlanmıştır ve bilinçli işlem kararları almanıza yardımcı olur. Bu EA strateji test cihazında çalıştırılamaz. KULLANICI KILAVUZU Ana Öz
ShSH: an Automated Trading Tool Discover the future of trading with our ShSH an Automated Trading Tool , meticulously designed to harness the unique characteristics of the daily market's volatility . This cutting-edge system leverages the price breakout method , Analizing on market movements during the low-liquidity hours to deliver consistent and reliable results. Core Features: 1. Intraday Market Volatility Mastery: The robot is fine-tuned to detect subtle price patterns and movements unique
Trading Chaos Expert
Gennadiy Stanilevych
5 (10)
This software has no equals in the world and represents a universal trade "console" covering trading signals, automated market entry, setting of Stop Loss and Take Profit, as well as Trailing Profit for multiple trades at the same time in a single open window. Intuitive control of the Expert Advisor in "three clicks" ensures a comprehensive use of all its functions on different computers, including tablets PCs. Interacting with additional signal indicators that mark the chart to give a real mark
Yazarın diğer ürünleri
MetaTrader 5 (MT5) için Wormhole Zaman Çerçevesi Göstergesi , sadece başka bir ticaret aracı değil—finansal piyasalarda sizin rekabet avantajınızdır. Hem yeni başlayanlar hem de profesyonel yatırımcılar için tasarlanan Wormhole, veri analiz etme ve karar verme yöntemlerinizi dönüştürerek her zaman bir adım önde olmanızı sağlar. Wormhole Göstergesine Neden İhtiyacınız Var? Rekabeti Geride Bırakın: Aynı grafik üzerinde aynı anda iki zaman çerçevesini görebilme yeteneği, her zaman bir adım önde olm
MT4 için Çift Zaman Dilimli Gösterge – Mumlar İçinde Mumlar Genel Bakış Mumlar İçinde Mumlar Gösterge, MT4 için özel olarak geliştirilmiş çok zaman dilimli bir görselleştirme aracıdır. Düşük zaman dilimli grafiğinizin üzerine, daha yüksek zaman dilimindeki mumları bindirerek, küçük mumların büyük mumlar içinde nasıl hareket ettiğini görmenizi sağlar. Bu yaklaşım, piyasa yapısını analiz etmeyi geliştirir, trend belirlemeyi güçlendirir ve fiyat hareketlerini netleştirir – grafikler arasında geçiş
FREE
MetaTrader 5 (MT5) için Wormhole zaman dilimi göstergesi sadece başka bir ticaret aracı değildir; finansal piyasalarda rekabet avantajınızdır. Hem acemi hem de profesyonel tüccarlar için tasarlanan Wormhole, verileri analiz etme ve karar verme şeklinizi değiştirerek her zaman bir adım önde olmanızı sağlar. Neden (ücretsiz) Wormhole Göstergesine İhtiyacınız Var Rakiplerinizi Geride Bırakın: Aynı grafikte iki zaman dilimini aynı anda görüntüleyebilme yeteneği, her zaman bir adım önde olmanızı sağl
FREE
Her Zaman Mükemmel İşlem – Bu Ticaret Asistanı EA'ye Neden İhtiyacınız Var? Bu EA Neden Tüm Traderlar İçin Bir Devrimdir? Ticaret, zamanlama, hassasiyet ve risk yönetimi ile ilgilidir. Başarı ile başarısızlık arasındaki fark, işlemleri ne kadar verimli yürüttüğünüze ve riskinizi nasıl yönettiğinize bağlıdır. Bu EA, ticareti zahmetsiz hale getirmek için tasarlanmıştır ve her işlemin yapısal, kontrollü ve uzun vadeli karlılık için optimize edilmiş olmasını sağlar. Bu EA'nin Sizin İçin Vazgeçilm
FREE
Move TakeProfit - Kullanım Talimatları Nasıl Kullanılır Sürükle ve Bırak Script’i, yeni TakeProfit seviyesini belirlemek istediğiniz grafiğe sürükleyin. Script’i istediğiniz fiyat seviyesinde bırakın. Onay Penceresi Script bırakıldıktan sonra bir onay penceresi açılacaktır. Değiştirilecek pozisyon sayısını ve kesin TakeProfit fiyatını gösterecektir. Devam etmek için "Evet", iptal etmek için "Hayır" butonuna tıklayın. Otomatik TakeProfit Güncelleme Onay verildiğinde, script mevcut grafik
FREE
Move StopLoss - Kullanım Talimatları Nasıl Kullanılır Sürükle ve Bırak Script’i, yeni StopLoss seviyesini belirlemek istediğiniz grafiğe sürükleyin. Script’i istediğiniz fiyat seviyesinde bırakın. Onay Penceresi Script bırakıldıktan sonra bir onay penceresi açılacaktır. Değiştirilecek pozisyon sayısını ve kesin StopLoss fiyatını gösterecektir. Devam etmek için "Evet", iptal etmek için "Hayır" butonuna tıklayın. Otomatik StopLoss Güncelleme Onay verildiğinde, script mevcut grafikteki tüm
FREE
Filtrele:
stefan1900
120
stefan1900 2025.02.15 17:09 
 

Kullanıcı incelemeye herhangi bir yorum bırakmadı

Scott Adam Meldrum
867
Geliştiriciden yanıt Scott Adam Meldrum 2025.02.15 17:42
Thanks - I did try input option for wick/box but the wicks often got hidden by wicks inside (smaller timeframe) the box worked out much better as it’s always visable. I will look at wicks again. Changing period on the fly ! I will look at that. Thanks for your input.
İncelemeye yanıt
Sürüm 2.7 2025.02.18
Fixed problem related to incomplete historical data.
Sürüm 2.6 2025.02.16
Added Custom Colors - (C) Let user define their own theme colors.
Sürüm 2.5 2025.02.16
Added ability to change period/2nd time frame on frontend.