DUN Lines
- Göstergeler
- Darren Mark Scott
- Sürüm: 1.0
- Etkinleştirmeler: 5
One of the most accurate ways to predict price movements is to identify imbalances. When we identify significant price imbalances (aka fair value gaps or fvgs/ifvgs), it becomes relatively easy to place trades based on continuations and retracements. A moving average simply cannot give you anywhere near the precision we find when we observe the reaction of price to an imbalance.
There are a few products on the market that claim to provide trading opportunities based on imbalances, but we believe ours provides the most flexibility to trade any open market at any time. Yes, the London and New York market opens provide large price movements in a short time window, but we believe many traders want additional or alternative trading opportunities. For example, if someone is unavailable during optimal weekday trading hours, the ability to catch some Bitcoin/BTCUSD moves on the weekend or some GBPJPY pips in the evening can be highly desirable and highly profitable.
This is Version 1.0 of DUN Lines and we believe it is a fantastic tool for helping to identify and visualize imbalances and the reaction of price. Rest assured that development of the indicator will continue and current creation and development of the DUN Lines expert advisor is moving at a rapid pace.
Please note that the indicator's current price is very much an introductory rate, so congratulations to those who purchase early. Also, please note that license holders of the DUN Lines indicator are eligible for an incredible 50% discount on the upcoming DUN Lines EA release.
How it works...
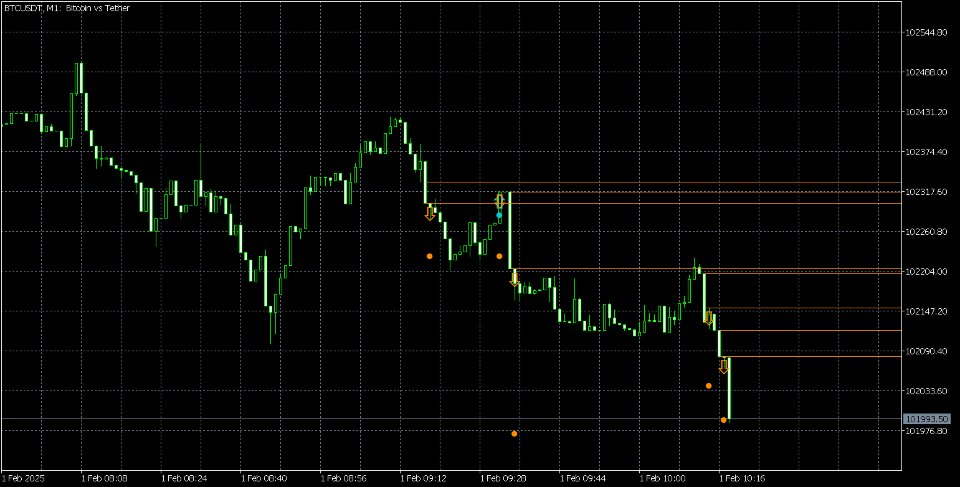
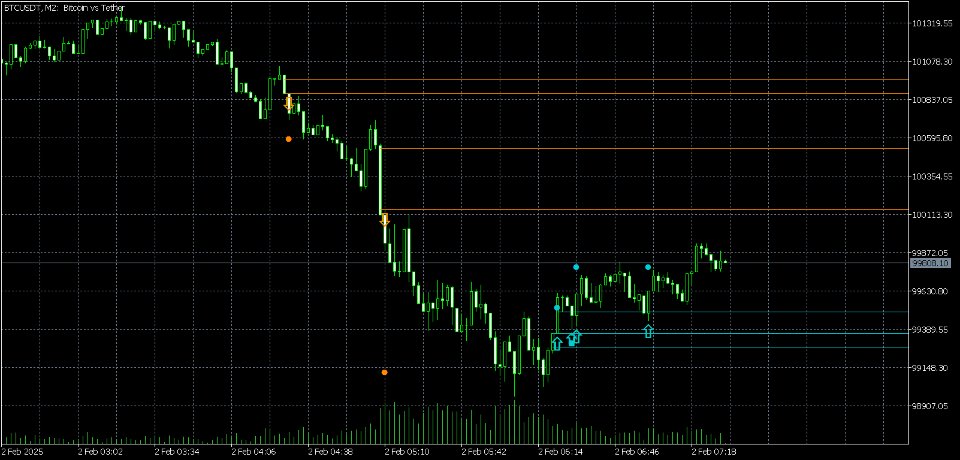
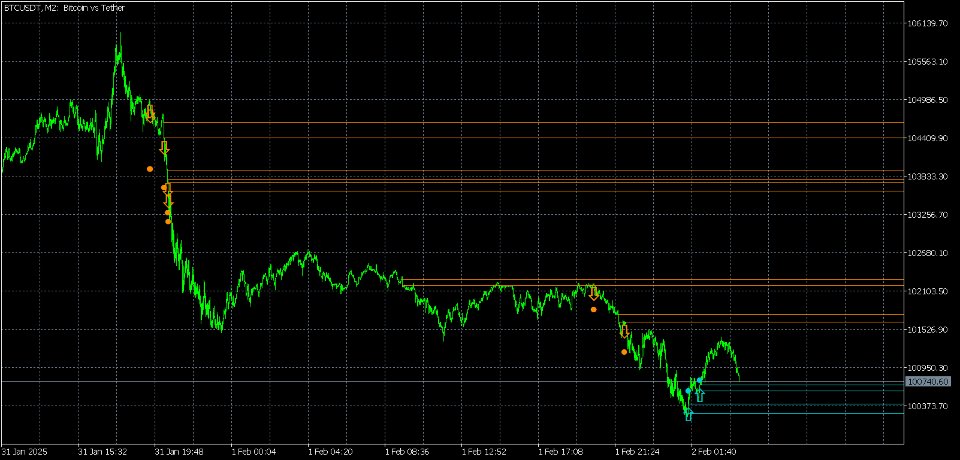
We love clean charts that don't bamboozle, give headaches or seizures. You'll notice that imbalances are cleanly indicated with top and bottom lines, with selectable colors for bullish and bearish zones. Directional arrows are displayed for potential trade entries and dots indicate suggested levels for profit taking.
Default settings are optimized for BTCUSD on a 2m timeframe. We will be providing additional set files as we continue our testing and development of the DUN Lines indicator. The options for tailoring the indicator to your preferred asset or pair are many and we recommend taking the time to determine optimal timeframes and other settings for a particular chart.
PLEASE NOTE: If you apply the indicator to a chart and you are not seeing any imbalances detected, reduce the minimum imbalance size to zero then gradually increase it to find a sweet spot that shows only significant areas of interest.
Input Parameters
| Timeframe | Detection of imbalances is based on this timeframe. Trading signals are based on the current timeframe. |
| Multiplier for candle size | Adjusts threshold for imbalance candles. Higher values require larger candles. |
| Minimum imbalance size in points | Raise this value to filter out smaller, less significant imbalances to increase. |
| Mitigation threshold (%) | When price retraces into the imbalance by a certain percentage, permanent mitigation occurs. |
| Color for bullish imbalance | Sets color for bullish lines and signals. |
| Color for bearish imbalance | Sets color for bearish lines and signals. |
| Width of lines | Sets width of top and bottom lines of imbalances. |
| Outer strike zone distance (%) | Furthermost zone, used for entries and exits of certain trades. Zone is above bullish imbalances and below bearish imbalances. Higher values increase aggressivity of trades. |
| Mid strike zone distance (%) | Between imbalance and outer strike zone line. Used for certain entry and exit calculations. Higher values produce more aggressive trades. We suggest keeping the value in the general vicinity of half the value of the outer strike zone distance. |
| Inner strike zone distance (%) | Closest zone to the imbalance. Used for certain entries and exit calculations. A low, positive value is suggested. |


