RSI on Moving Average Indicator for MT5
- Göstergeler
- Eda Kaya
- Sürüm: 1.5
RSI on Moving Average Indicator for MT5
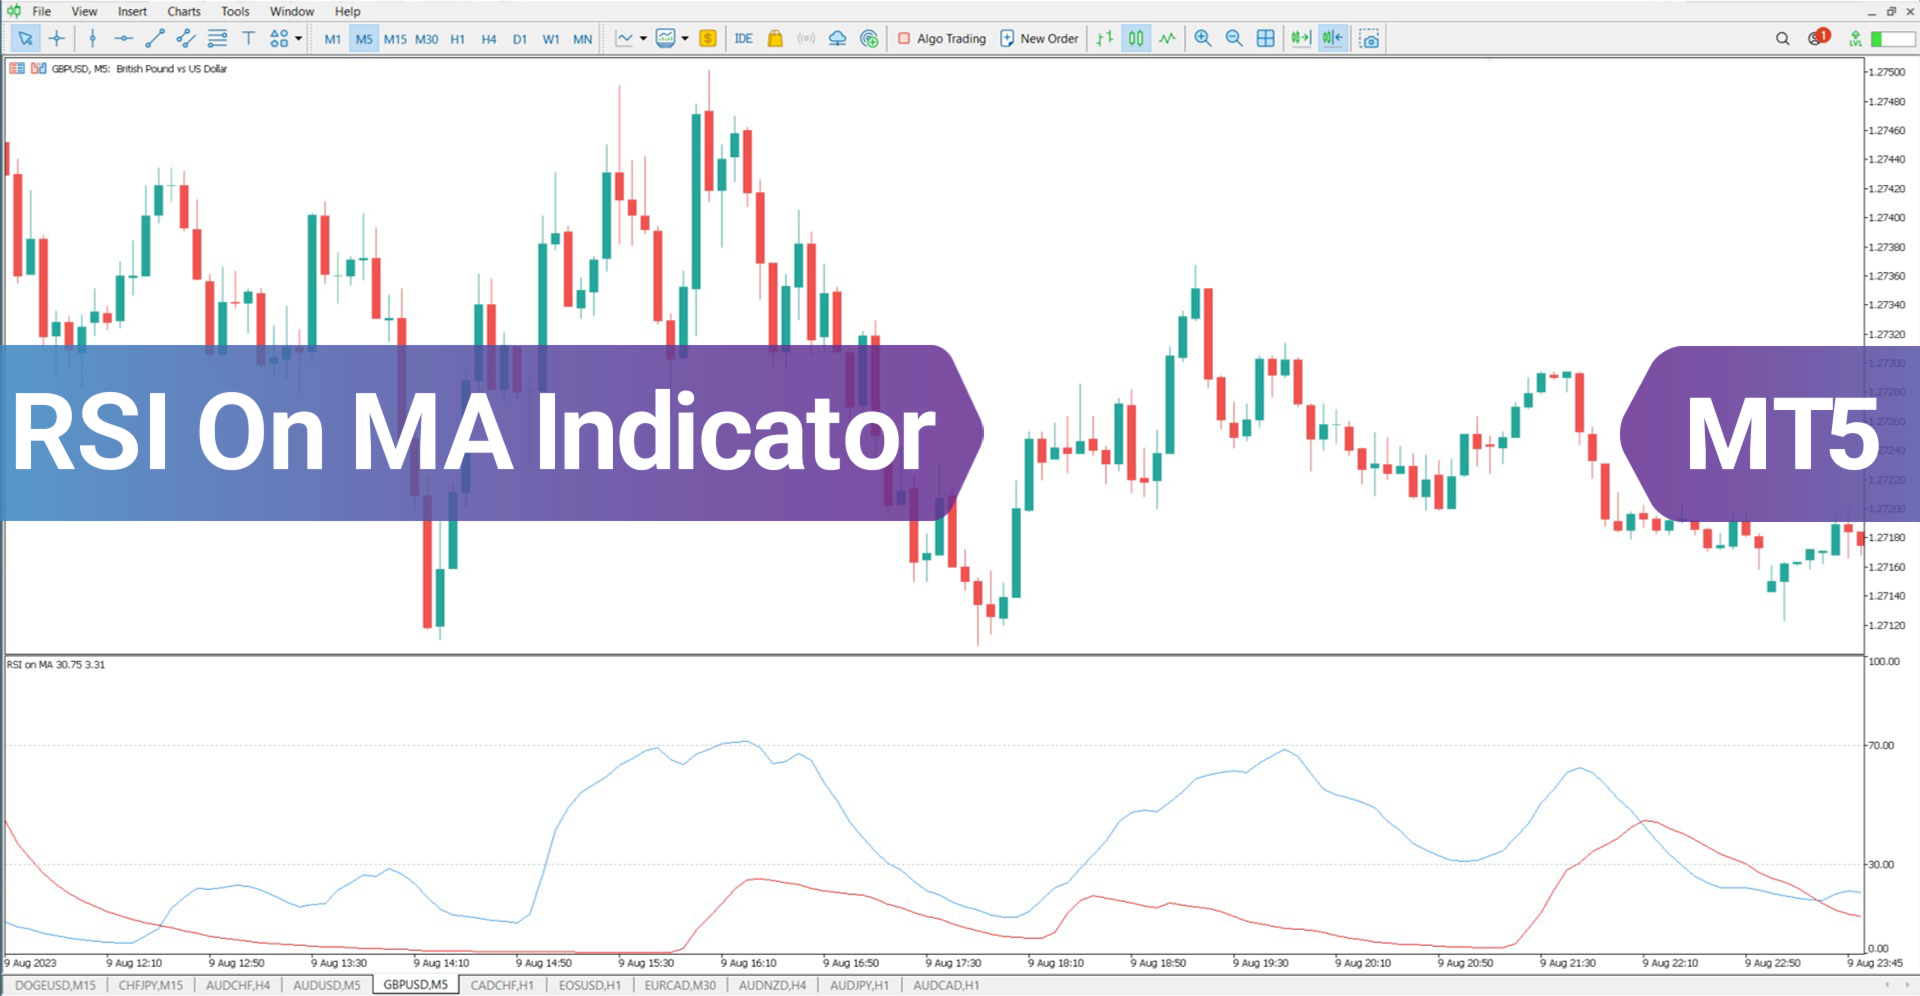
The RSI on MA Indicator integrates Moving Average Crossovers with the Relative Strength Index (RSI) to enhance trend detection and momentum analysis. By merging these technical elements, it improves precision in identifying market movements. The indicator displays two oscillating lines ranging from 0 to 100, making it easier to pinpoint buy and sell opportunities while clarifying trend directions.
«Indicator Installation & User Guide»
MT5 Indicator Installation | RSI on Moving Average Indicator for MT4 | ALL Products By TradingFinderLab | Best MT5 Indicator: Refined Order Block Indicator for MT5 | Best MT5 Utility: Trade Assistant Expert TF MT5 | TP & SL Tool: Risk Reward Ratio Calculator RRR MT5 | Money Management: Easy Trade Manager MT5
RSI on Moving Average Indicator Specifications
The key specifications of this indicator are outlined in the table below:
| Category | Trading Tool - Oscillator - Volatile |
| Platform | MetaTrader 5 |
| Skill Level | Intermediate |
| Indicator Type | Leading - Continuation |
| Timeframe | Multi-timeframe |
| Trading Style | Intraday Trading |
| Trading Market | Cryptocurrency - Forex - Stocks |
Overview of the Indicator
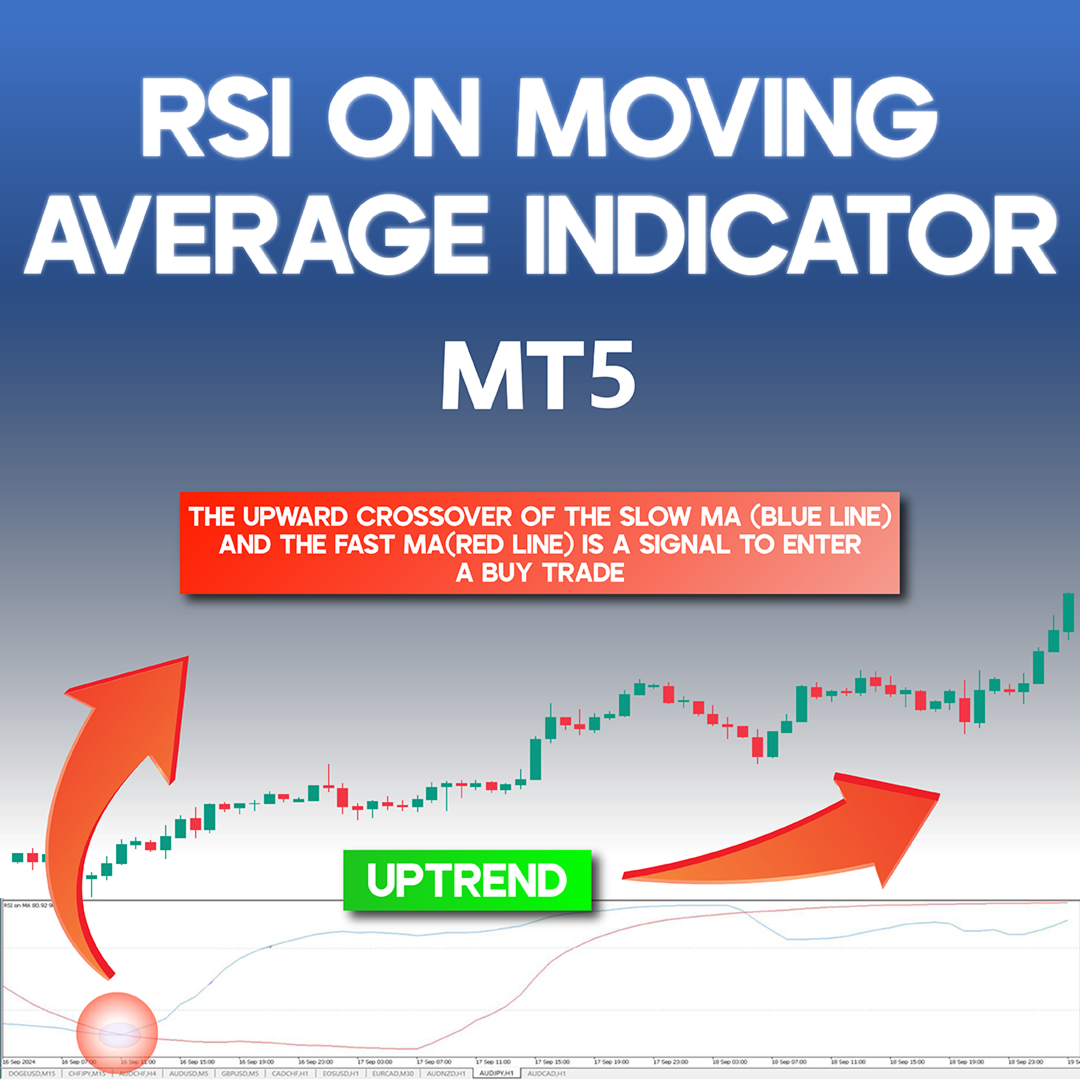
This indicator applies the Relative Strength Index (RSI) based on moving averages to deliver better insights into market activity. The blue line indicates the slower-moving average, whereas the red line represents the faster-moving average. A trade signal is generated when these lines intersect, confirming potential entry points.
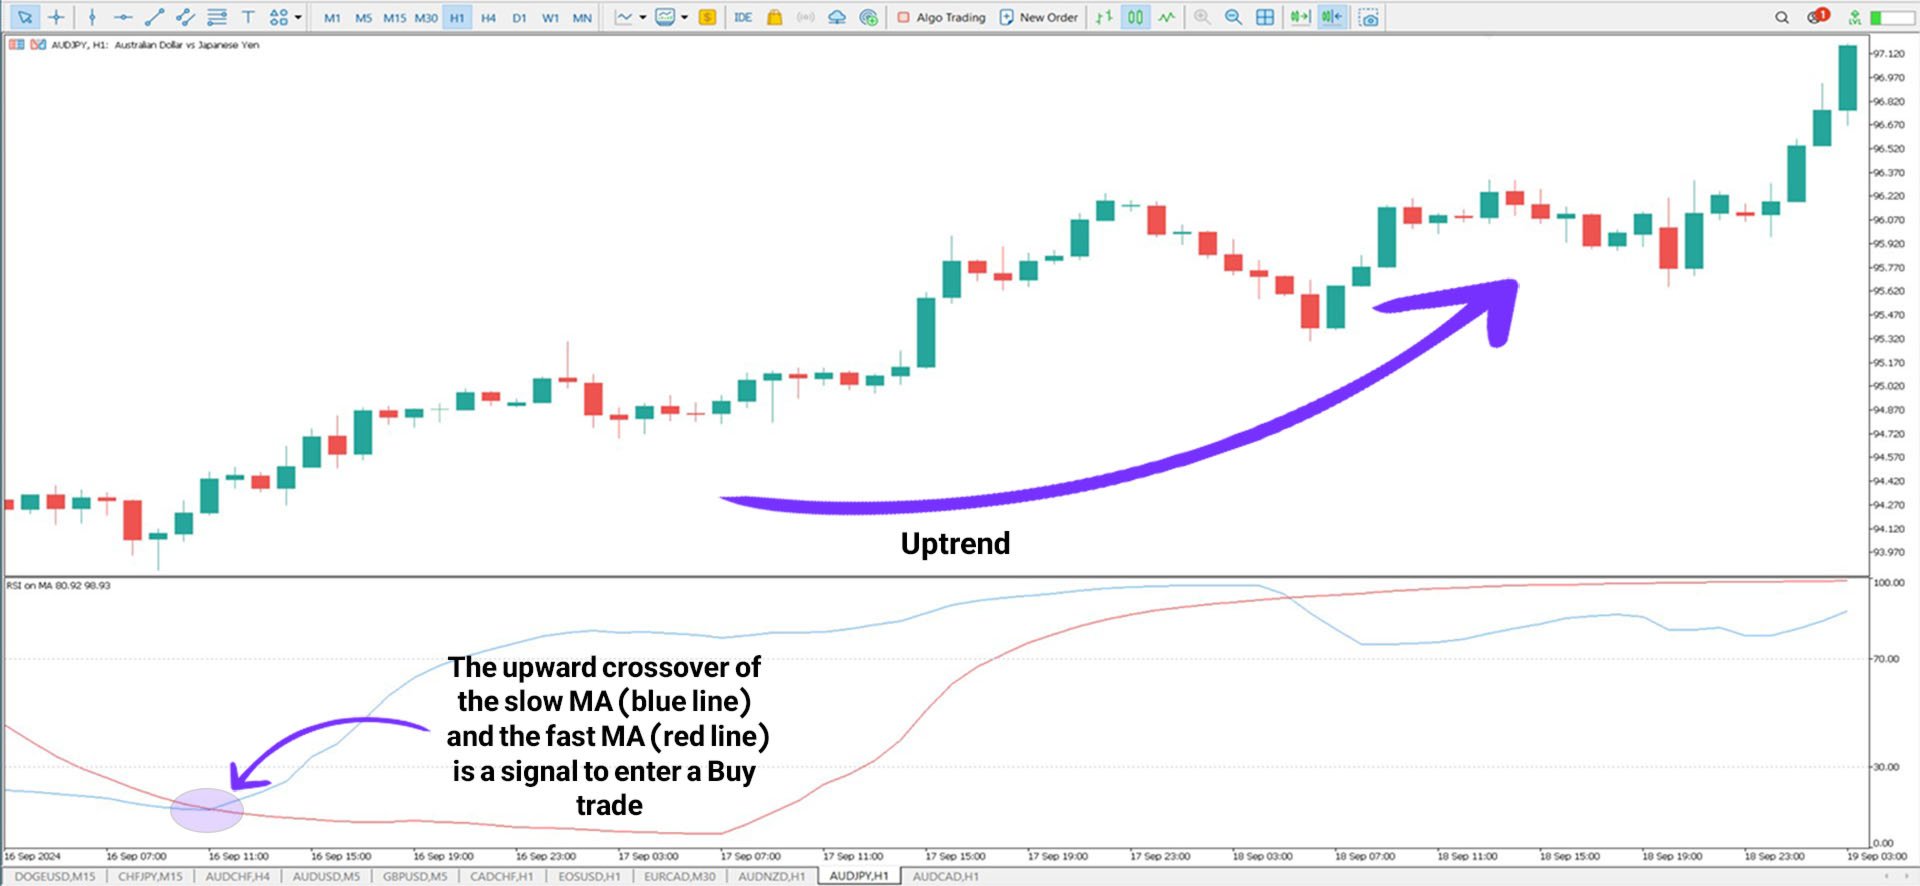
Indicator in an Uptrend
When the fast-moving line (red) and the slow-moving line (blue) converge near the 0 level and the slow line crosses the fast line upward, it signifies the onset of an uptrend. Traders can use additional confirmations before executing a buy order.
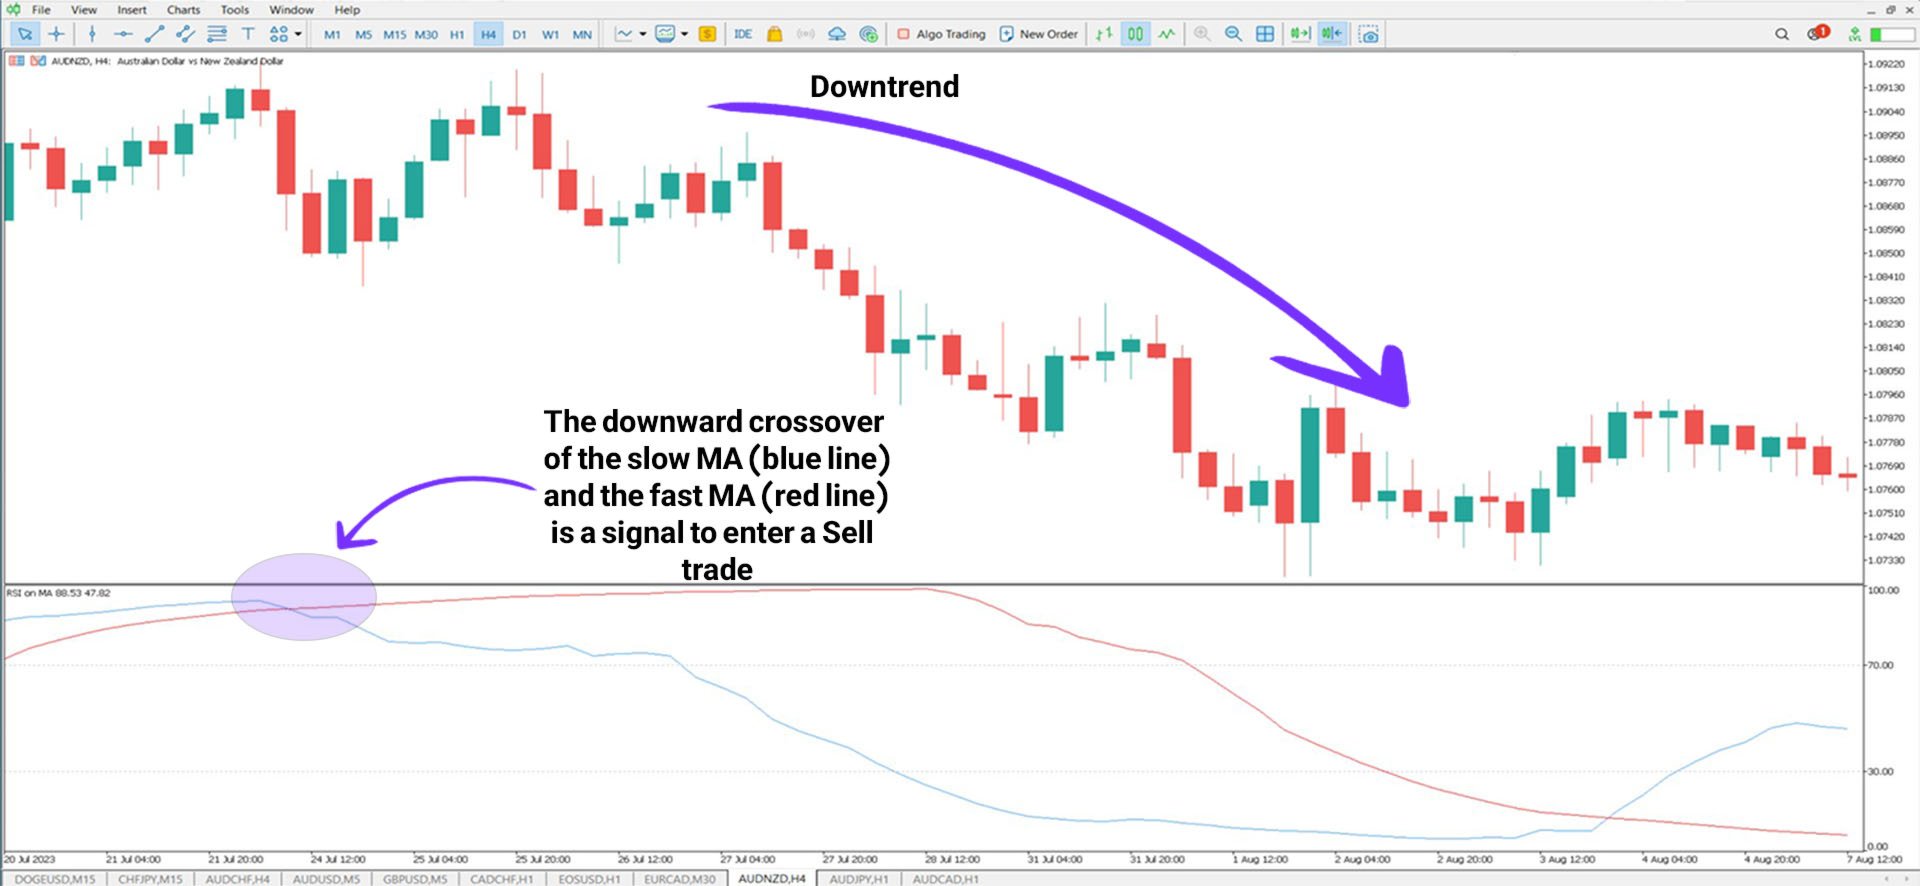
Indicator in a Downtrend
On the AUD/NZD currency pair’s 4-hour chart, when the two moving averages near the 100 level and the slow-moving line (blue) crosses the fast-moving line (red) downward, it indicates a sell opportunity. Traders should apply further validation before proceeding with a trade.
RSI on Moving Average Indicator Settings
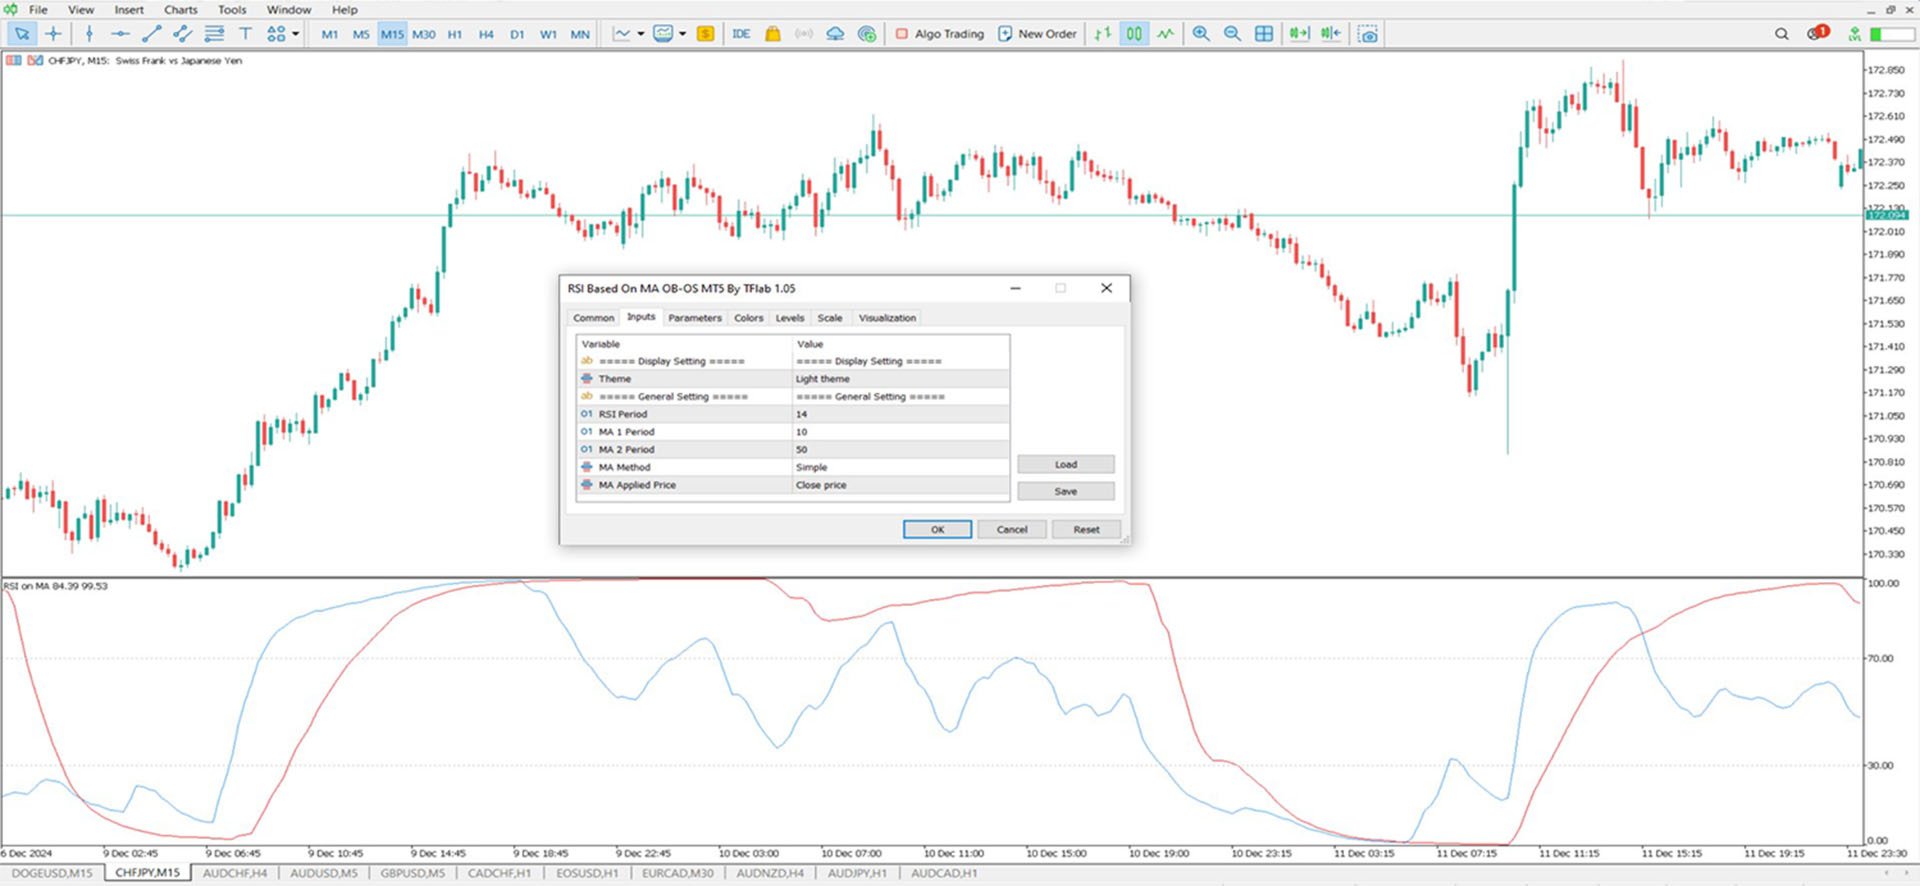
The image below outlines the primary settings of the RSI on Moving Average Indicator:
- Theme: The background appearance of the indicator chart;
- RSI Period: The number of candles considered for RSI calculation;
- First Moving Average Period: The time period for the faster-moving average;
- Second Moving Average Period: The time period for the slower-moving average;
- Moving Average Mode: The type of moving average applied;
- Price Mode: The price type used (Open, Close, High, or Low).
Conclusion
The RSI on MA Indicator is a robust tool that merges the Relative Strength Index (RSI) with moving averages to enhance trend identification and market momentum analysis. With its two oscillating lines operating between 0 and 100, it effectively highlights crossover signals for better trade execution.