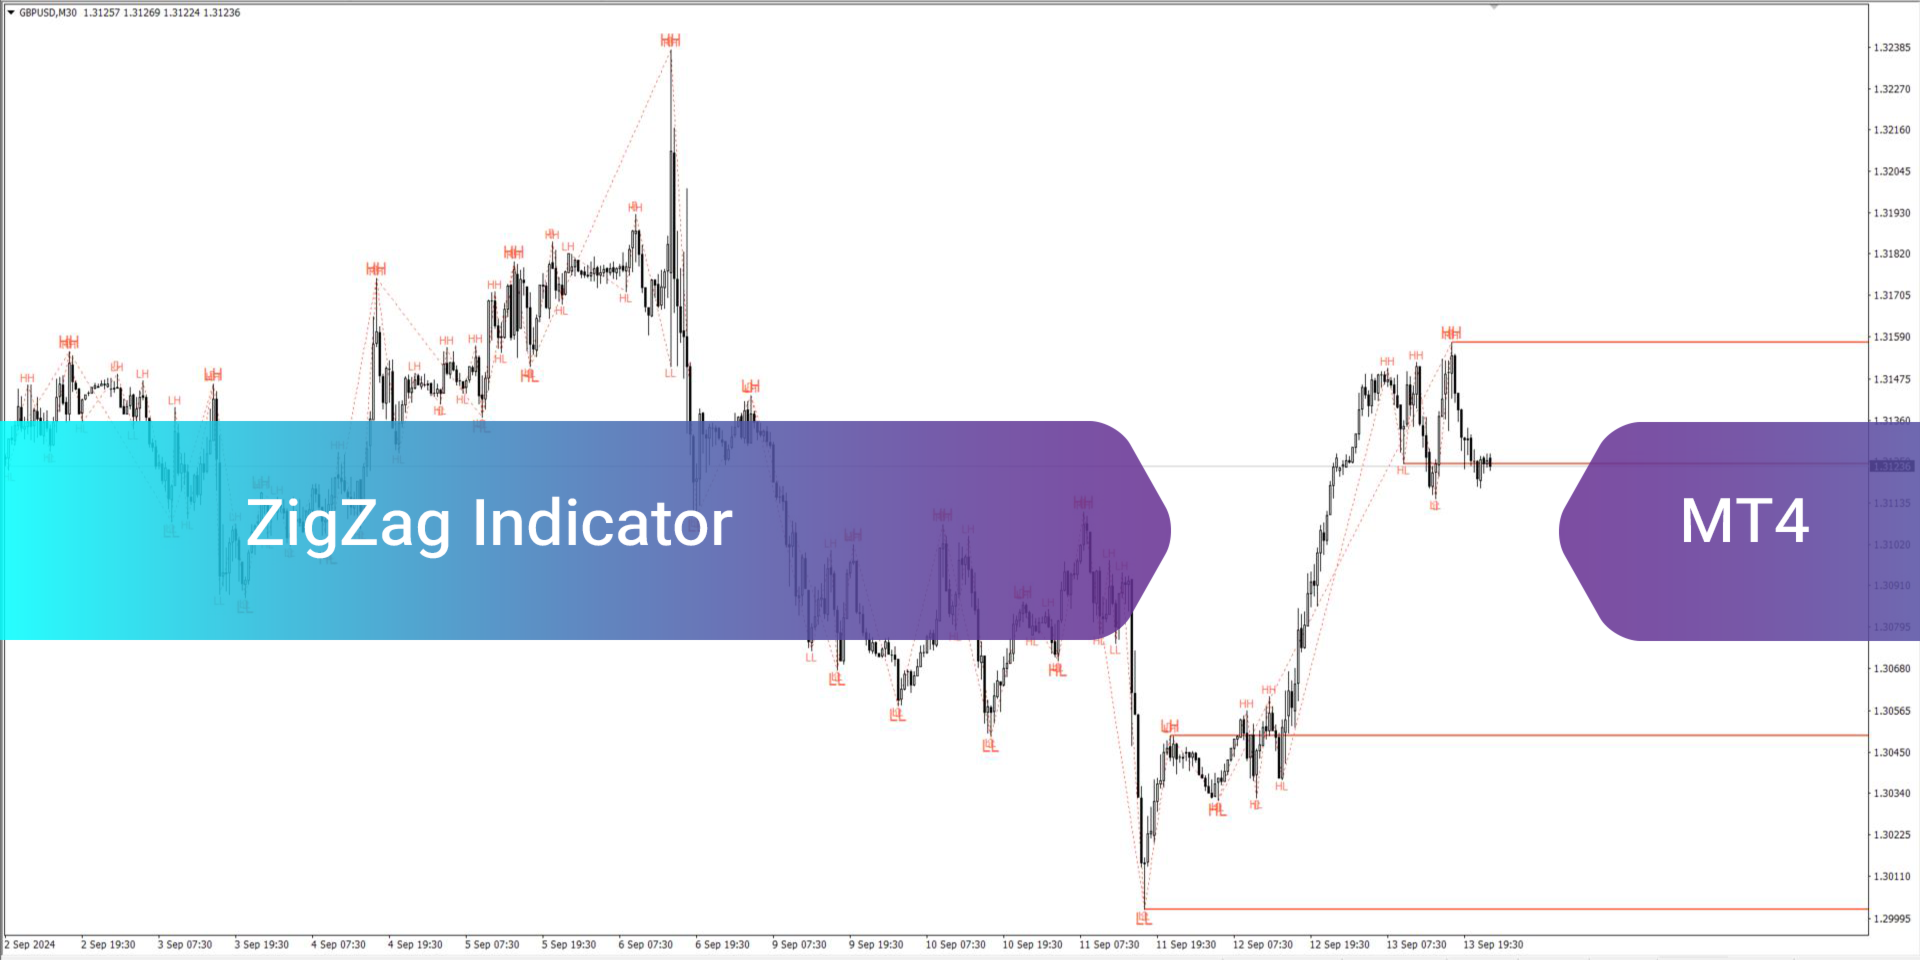
ZigZag Indicator for MT4
- Göstergeler
- Eda Kaya
- Sürüm: 1.6
ZigZag Indicator for MT4
The ZigZag Indicator in MetaTrader 4 is a popular tool designed to pinpoint significant highs and lows (pivot points) on price charts. It highlights both Major and Minor pivots, helping traders spot potential chart reversal zones. These pivots are labeled as HL, HH, LH, and LL, which aid in recognizing dominant and short-term trends. Identifying peaks and troughs is crucial for any trading strategy, as it assists in understanding key turning points and locating areas of support and resistance on the chart.
Indicator Table
|
|
|
Overview
Recognizing pivot points is a fundamental aspect of technical analysis that benefits all trading strategies. The ZigZag Indicator identifies major turning points and the smaller intermediate pivots between them, making it particularly effective for detecting classic chart patterns like Double Tops, Double Bottoms, and Head & Shoulders formations.
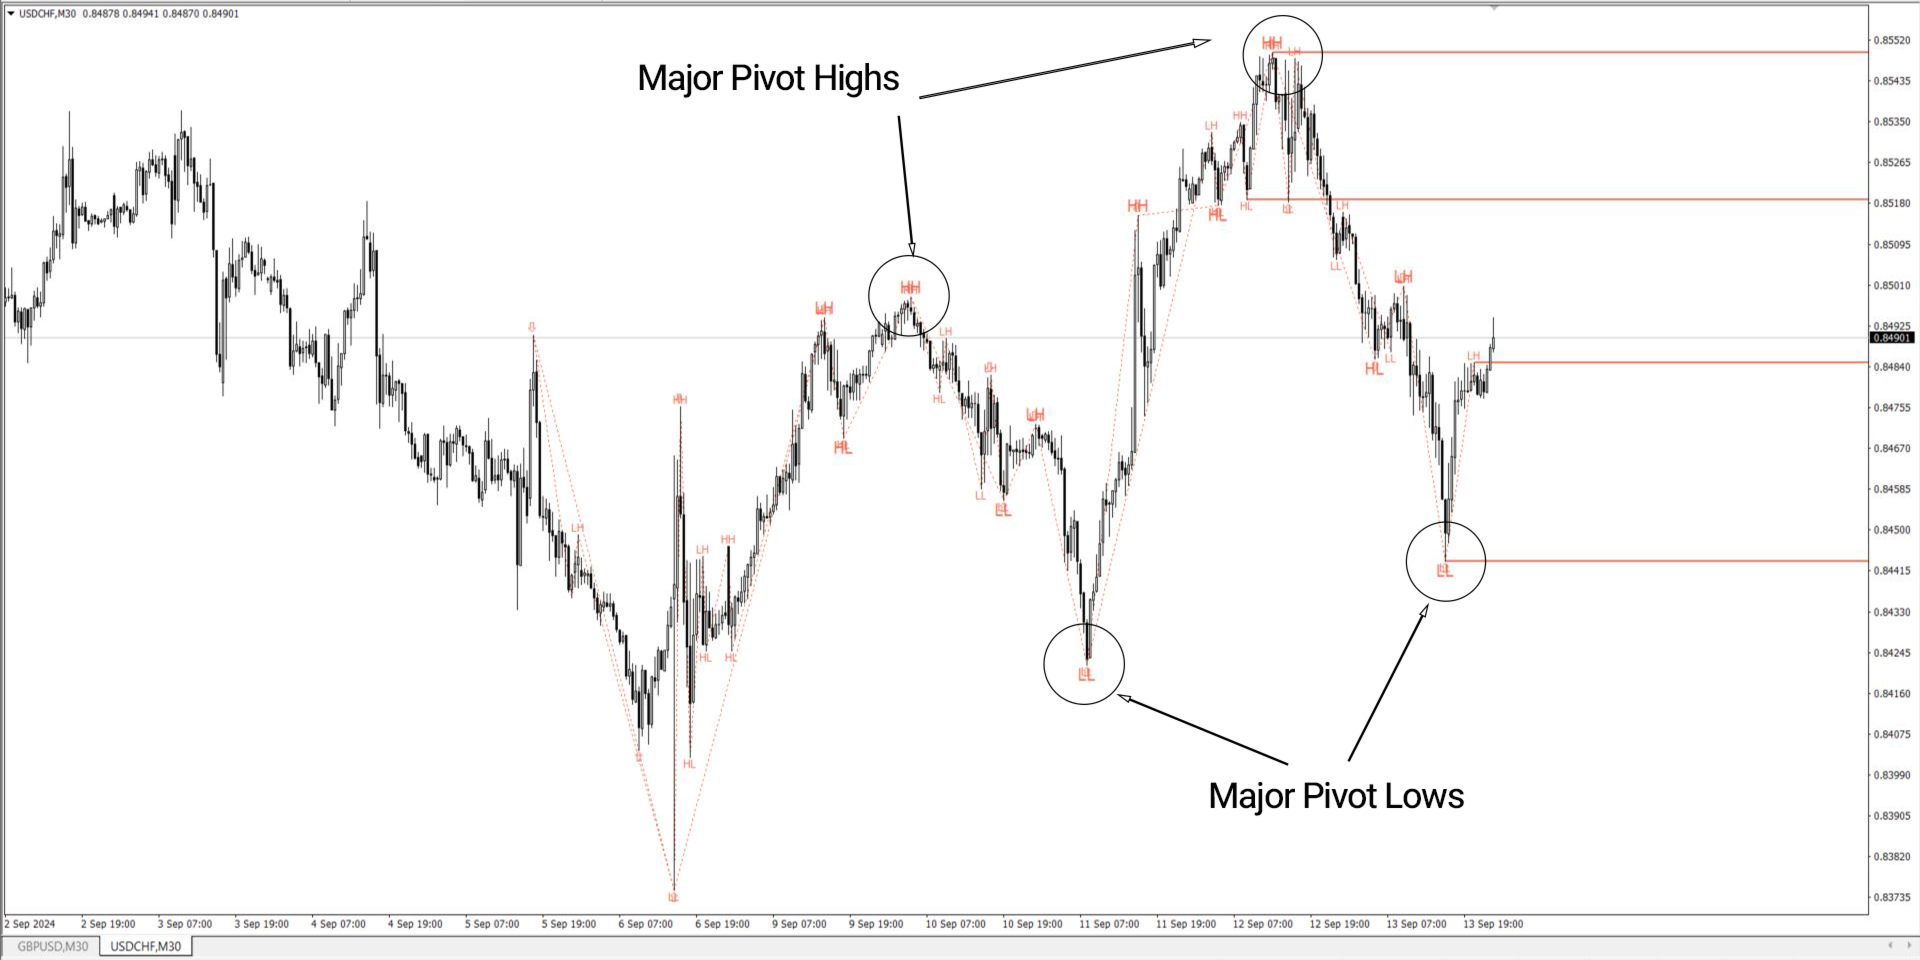
Major Pivots (Key Turning Points)
The chart of the USD/CHF currency pair on a 30-minute timeframe demonstrates how the indicator displays major pivot lows (large troughs) labeled as LL and major pivot highs (prominent peaks) as HH, in a larger font. These key pivots provide an overview of the main market trend. In this example, the trend is identified as upward, based on higher key peaks and troughs.
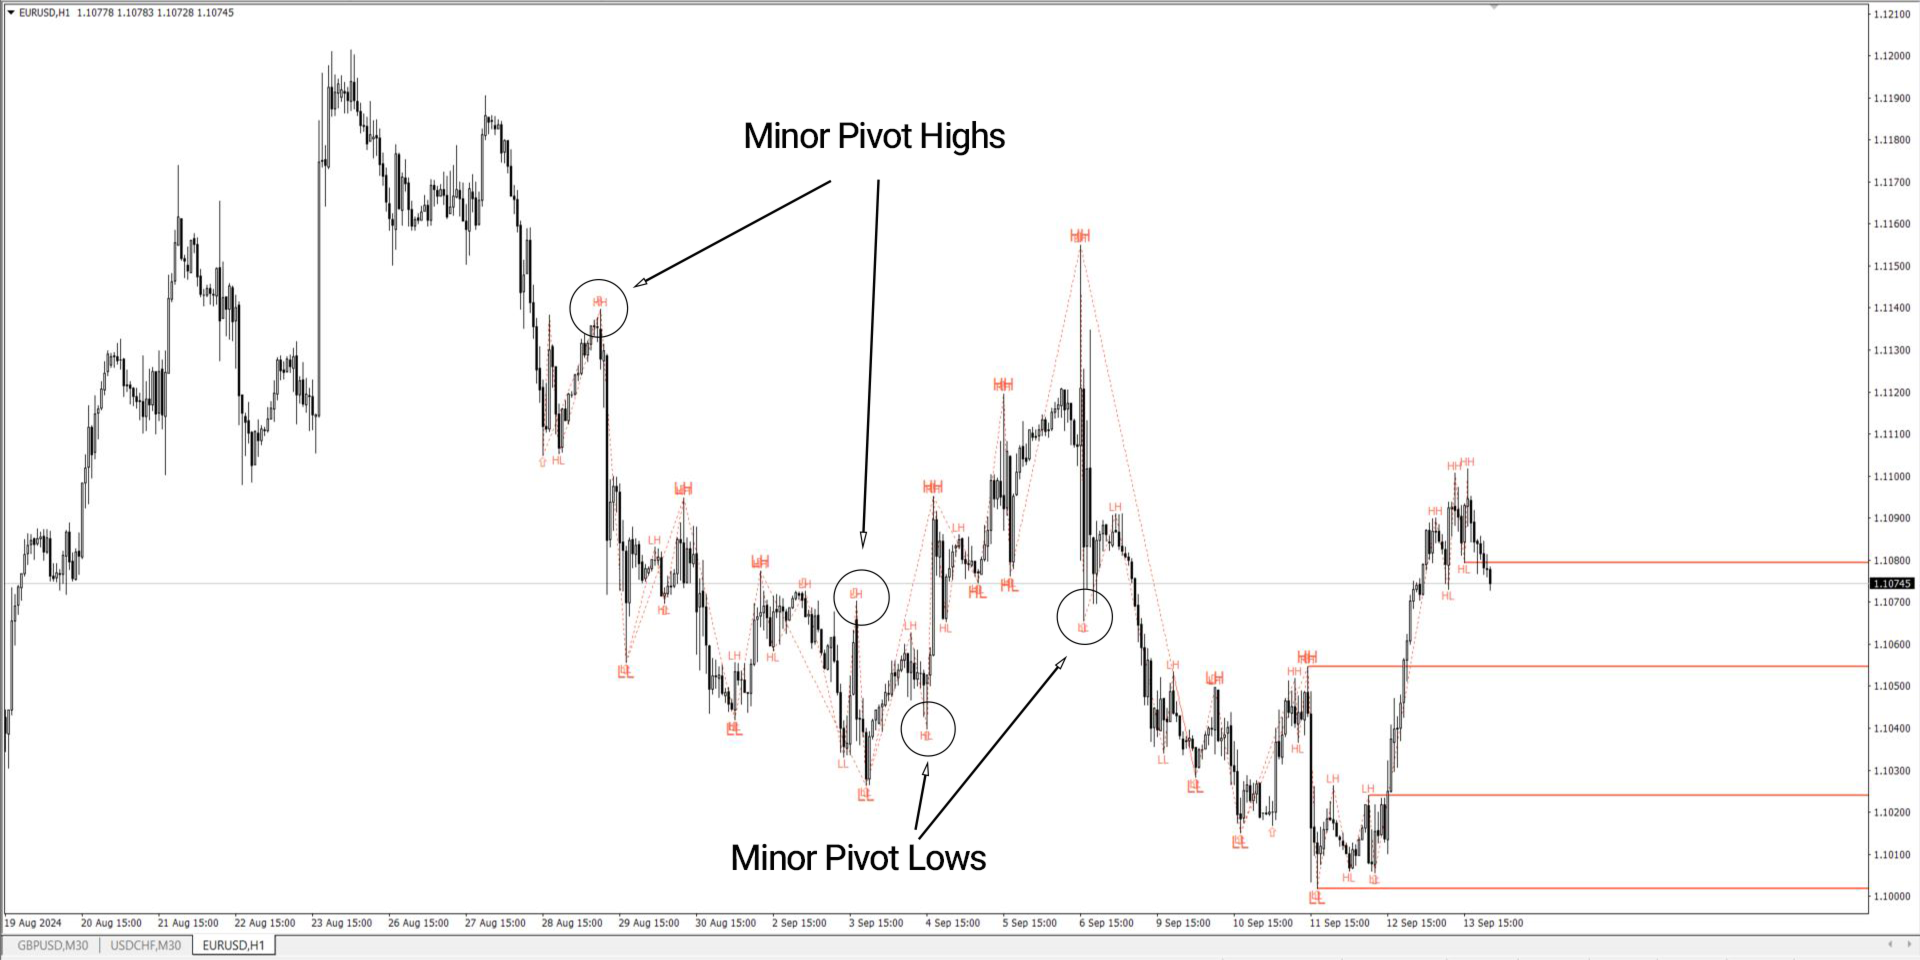
Minor Pivots (Smaller Turning Points)
On a EUR/USD 1-hour chart, the indicator highlights minor pivot lows (smaller troughs) using HL-LL labels in a smaller font size and minor pivot highs (smaller peaks) using HH-LH labels. These minor pivots allow traders to observe the smaller fluctuations that occur between two major pivots, offering detailed insights into short-term price movements.
Support and Resistance
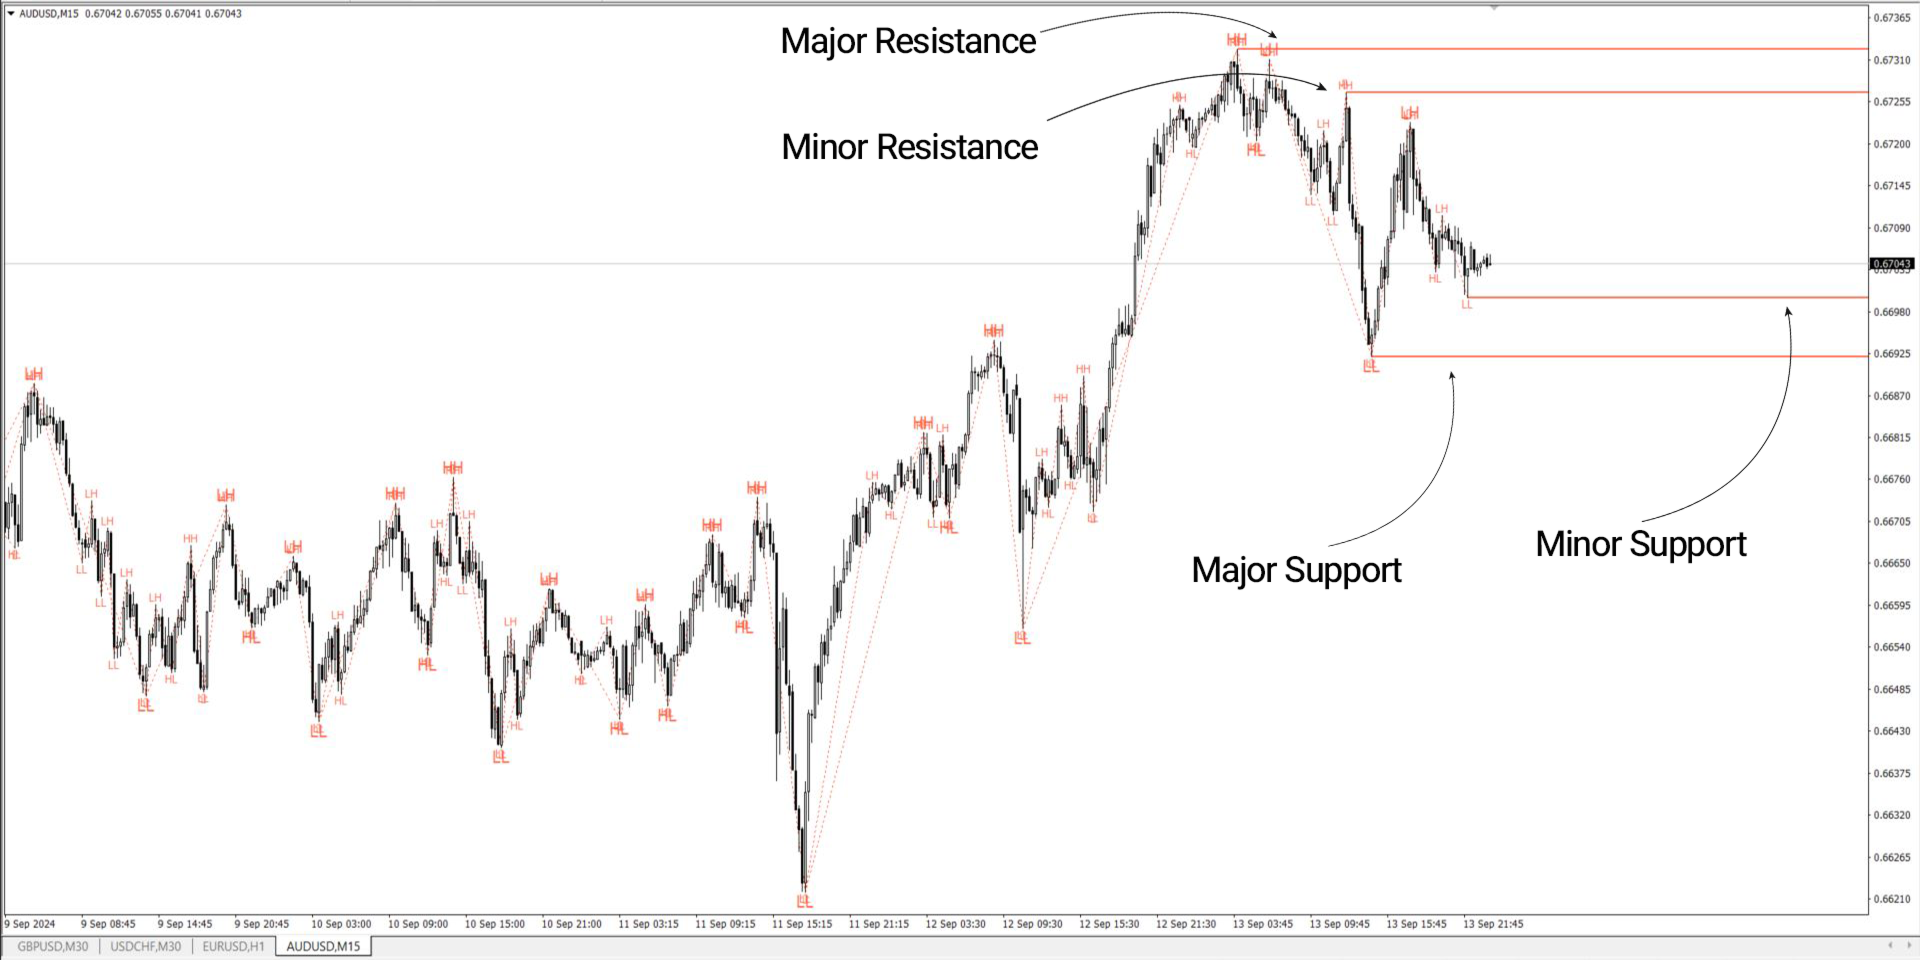
A practical method for identifying support and resistance is by marking pivot levels. For example, in a 15-minute AUD/USD chart, the ZigZag Indicator plots major support and resistance based on recent significant highs and lows. Additionally, the indicator identifies short-term support and resistance using minor pivot levels, allowing traders to understand both long-term and short-term market dynamics.
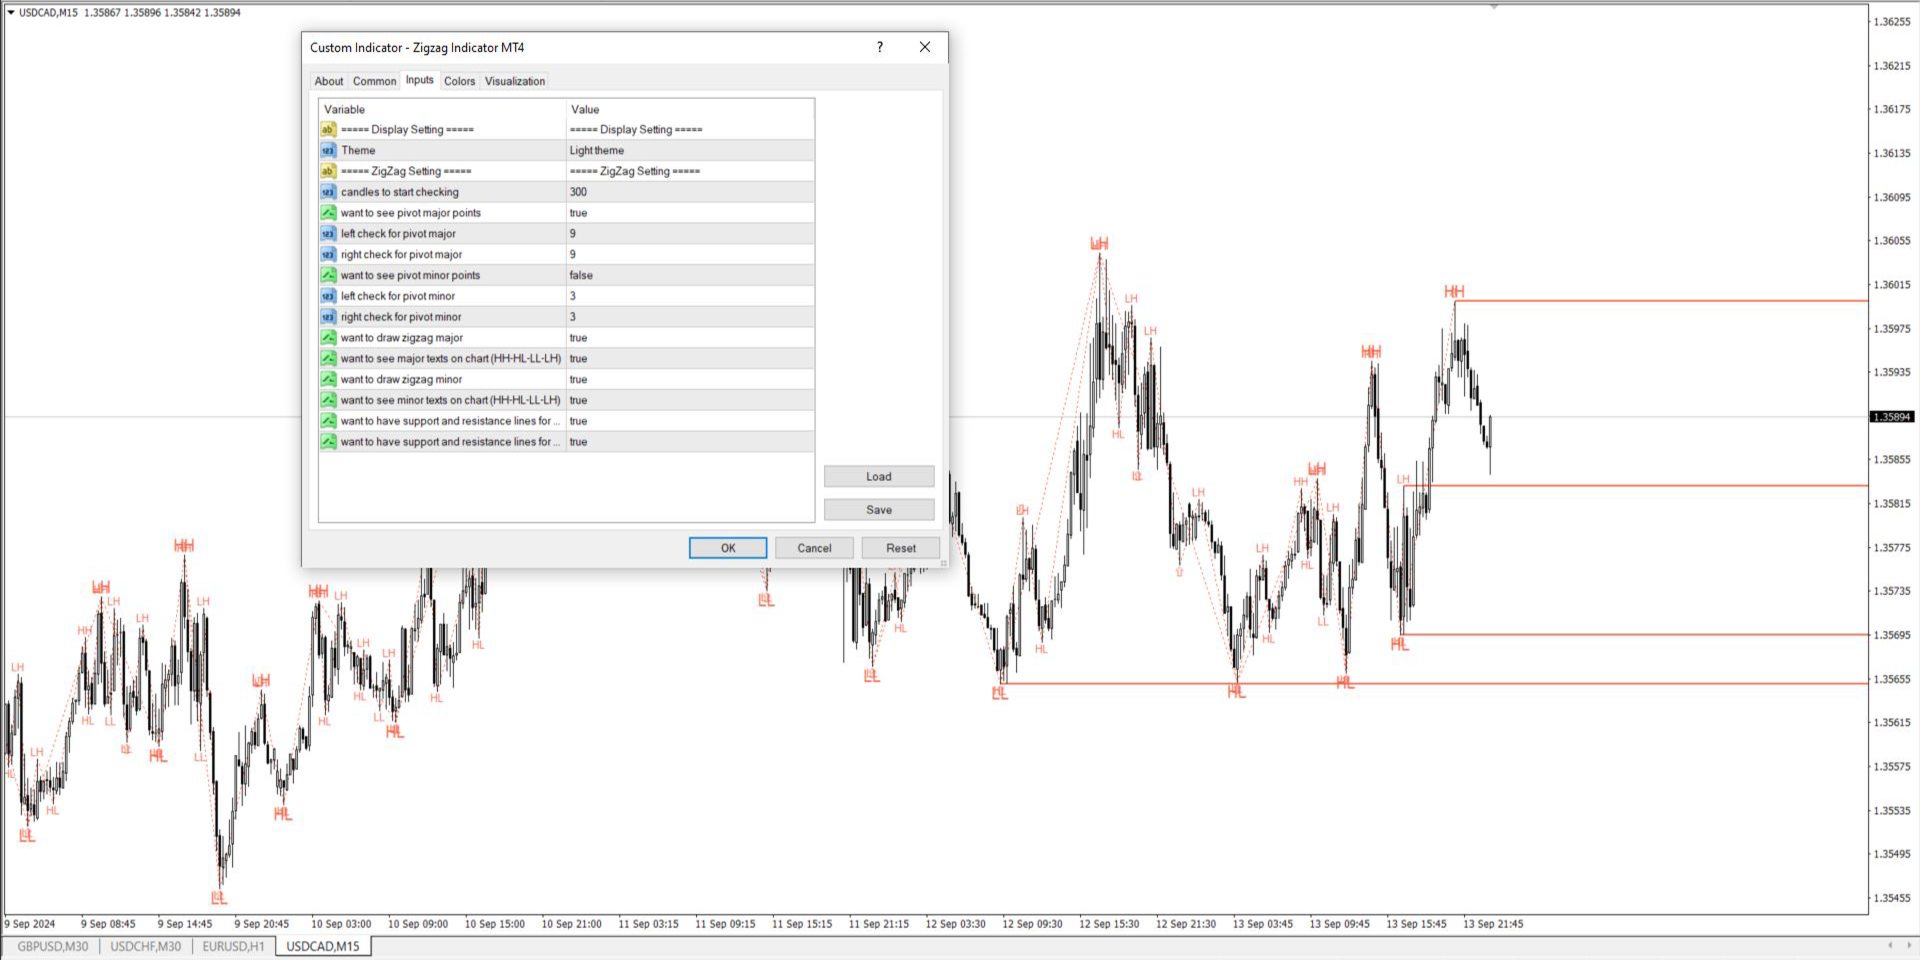
Indicator Settings
- Display Settings: Fully customizable display options.
- Theme: Adjust background settings as preferred.
- ZigZag Settings: Modify zigzag line parameters.
- Candles for Calculation: Default set to 300 candles.
- Show Major Pivots: Enables visibility of major pivot points.
- Major Pivot Check (Left/Right): Set to 9 candles on both sides.
- Show Minor Pivots: Enables visibility of minor pivot points.
- Minor Pivot Check (Left/Right): Set to 3 candles on both sides.
- Draw Major Zigzag: Option to display major zigzag lines.
- Label Major Points (HH-HL-LL-LH): Option to label major pivots.
- Draw Minor Zigzag: Option to display minor zigzag lines.
- Label Minor Points (HH-HL-LL-LH): Option to label minor pivots.
- Support/Resistance for Major Trend: Enable major S/R lines.
- Support/Resistance for Minor Trend: Enable minor S/R lines.
Note: Any of these options can be disabled to hide specific pivots or support/resistance lines.
Summary
Understanding chart pivots and turning points is essential for traders of all levels. The ZigZag Indicator provides automatic identification of pivot points and key support and resistance levels, enhancing trading precision. By integrating this tool with other strategies, traders can gain better insights into market movements and improve decision-making accuracy.