• Genel bakış
  • İncelemeler
  • Yorumlar

TD Sequential for MT5

Indicator
Sequential®

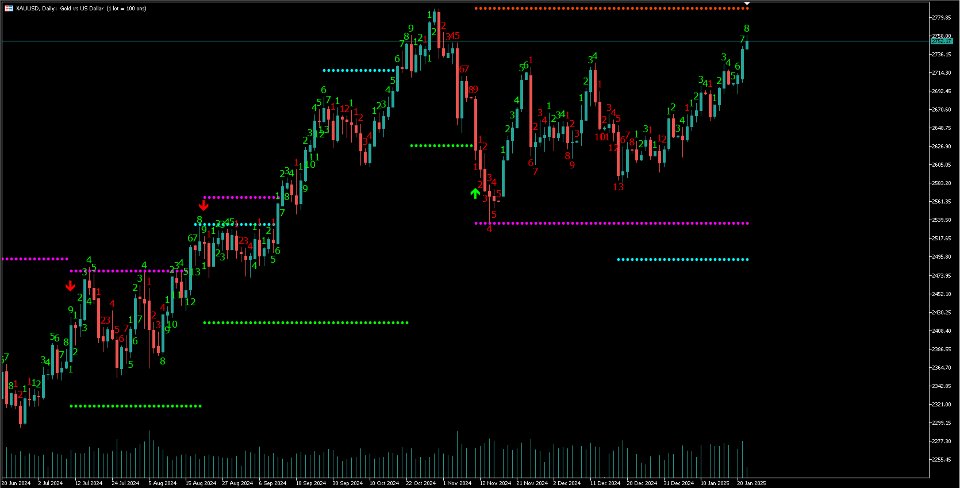
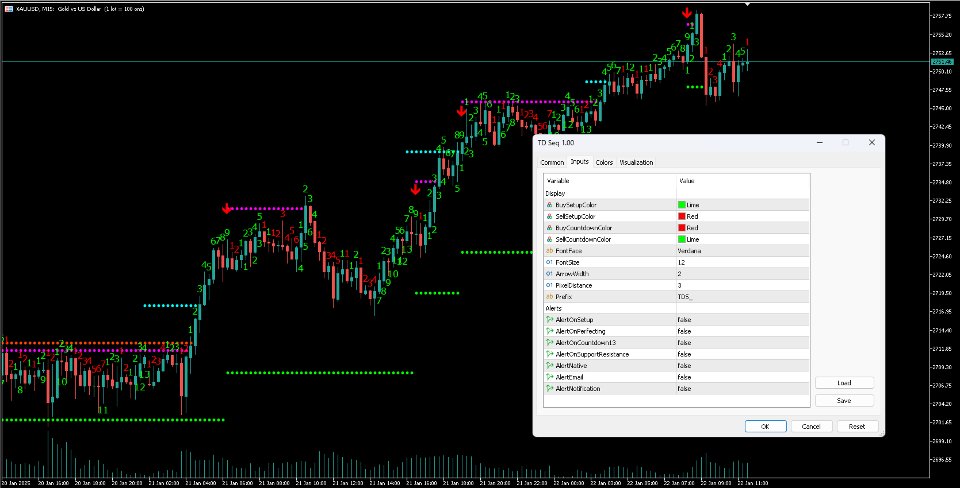
Through a multi-phase price comparative process consisting of the Setup and Countdown indicators, the Sequential indicator analyzes otherwise incongruent price data to provide insight into the strength or weakness of the market’s trend and its likelihood of reversing

The Mechanics of Sequential

We have the market's number

The majority of the DeMARK Indicators are designed to anticipate price exhaustion as opposed to following the trend. Identifying likely inflection points provides an ideal opportunity to buy into weakness and sell into strength, ensuring an improved cost basis and the ability to gradually build a position.

Figuratively speaking, markets top not because of smart sellers, but because the last buyer has bought. Conversely, markets bottom not because of smart buyers, but because the last seller has sold.

Market tops and bottoms are typically associated with an overwhelming belief that the trend will continue. While many espouse the long-held expression that, “the trend is your friend,” we believe it’s important to add the corollary, “unless the trend is about to end.”

Identifying probable points of inflection improves your cost basis, decreases your risk and allows you to participate in a greater portion of the market’s subsequent trend.

Sequential intro­duces precision and objectivity into market timing by identify­ing areas at which market tops and bottoms are likely.

Yazarın diğer ürünleri
Optimized Trend Tracker OTT is an indicator that provides traders to find an existing trend or in another words to ser which side of the current trend we are on. We are under the effect of the uptrend in cases where the prices are above OTT , under the influence of a downward trend, when prices are below OTT it is possible to say that we are. The first parameter in the OTT indicator set by the two parameters is the period/length. OTT will be much sensitive to trend movements if it is sma
An oscillator that shows price changes and identifies areas of overbought and oversold. It can also show trend reversal points. WaveTrend Oscillator is a port of a famous TS /MT indicator. When the oscillator is above the overbought band (red lines) and crosses down the signal (solid line), it is usually a good SELL signal. Similarly, when the oscillator crosses above the signal when below the Oversold band (green lines), it is a good BUY signal. Good luck.
Murrey Math Lines The concept of this technical analysis system was developed by T. Henning Murrey in 1995 and described in The Murrey Math Trading System; For All Markets. The main concept here is that all markets behave in the same manner based upon the observations made by W.D. Gann. To date, the Murrey Math Line X it is one the most popular methods of Forex analysis and trading. Formula The Murrey Math Line X is calculated with the help of price movement segment, which, in accordance to Gan
Filtrele:
İnceleme yok
İncelemeye yanıt