Coloured Parabolic SAR
- Göstergeler
- Moegamat Luqmaan Titus
- Sürüm: 1.3
- Güncellendi: 30 Ocak 2025
Overview:
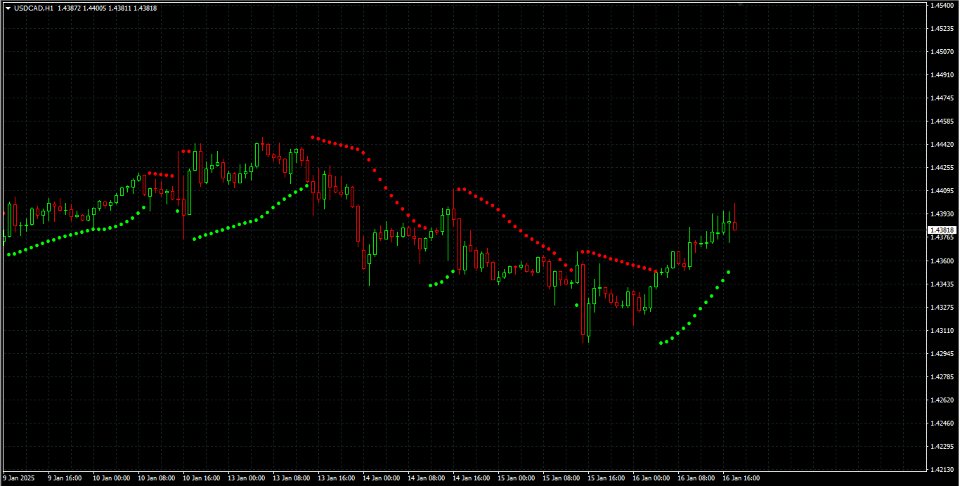
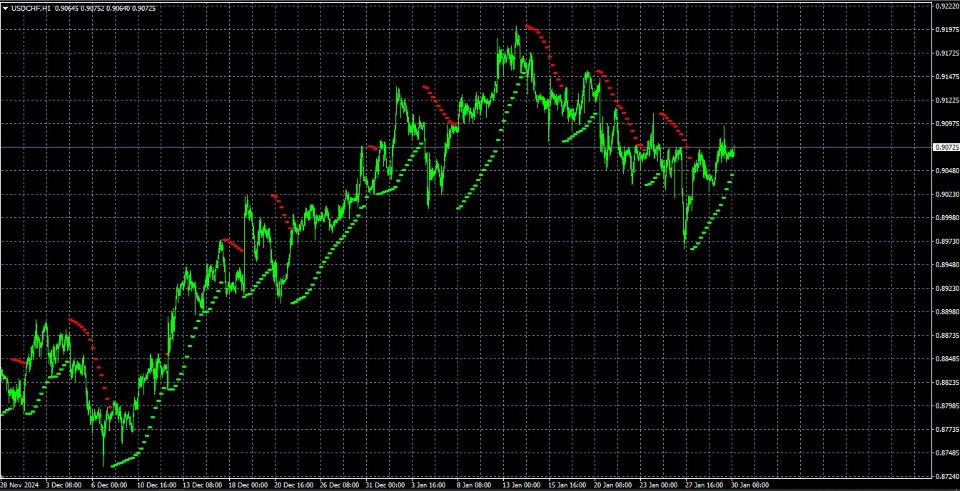
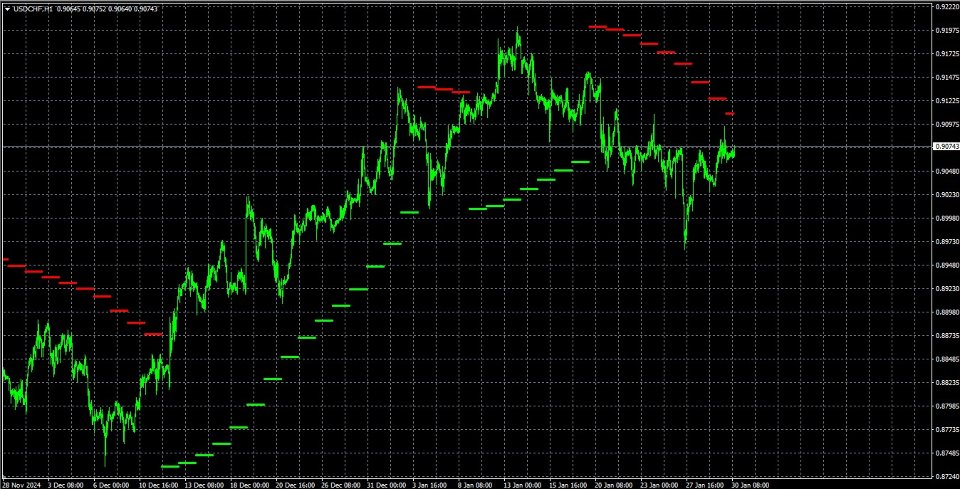
The Coloured Parabolic SAR Indicator is a visually enhanced trading tool designed to make trend-following and trade identification easier. This customizable indicator provides clear visual cues with color-coded signals for bullish (buy) and bearish (sell) trends directly on your MT4 chart.
Key Features:
- Color-Coded Signals:
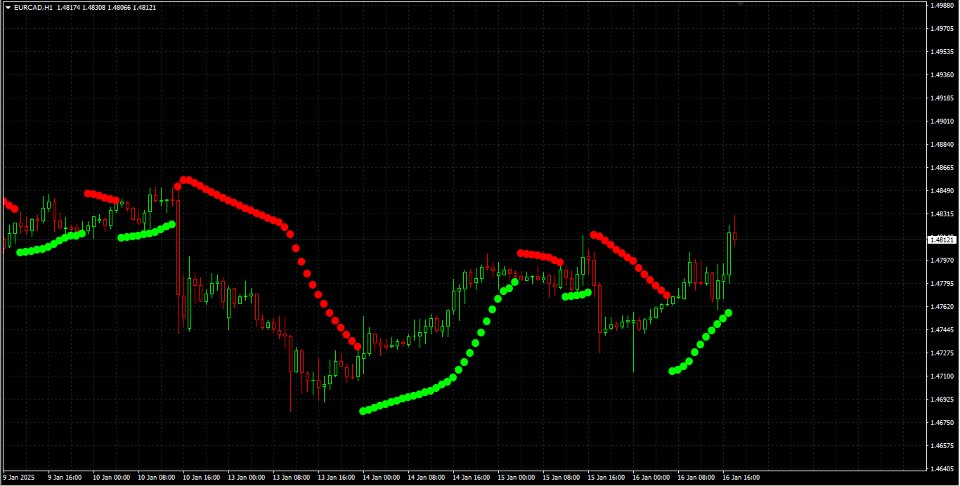
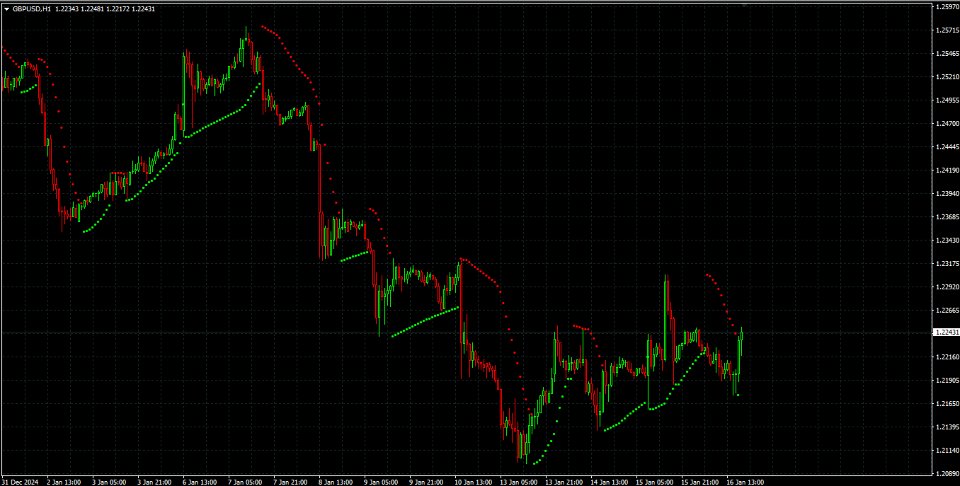
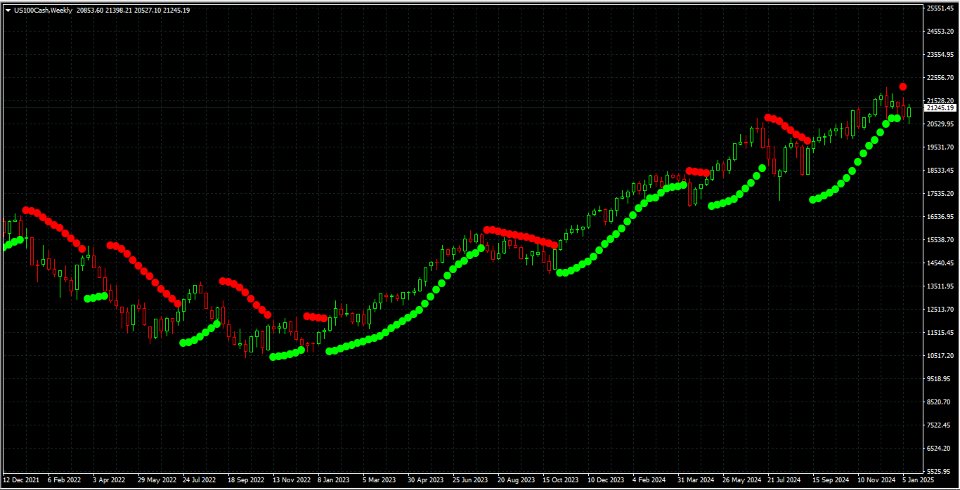
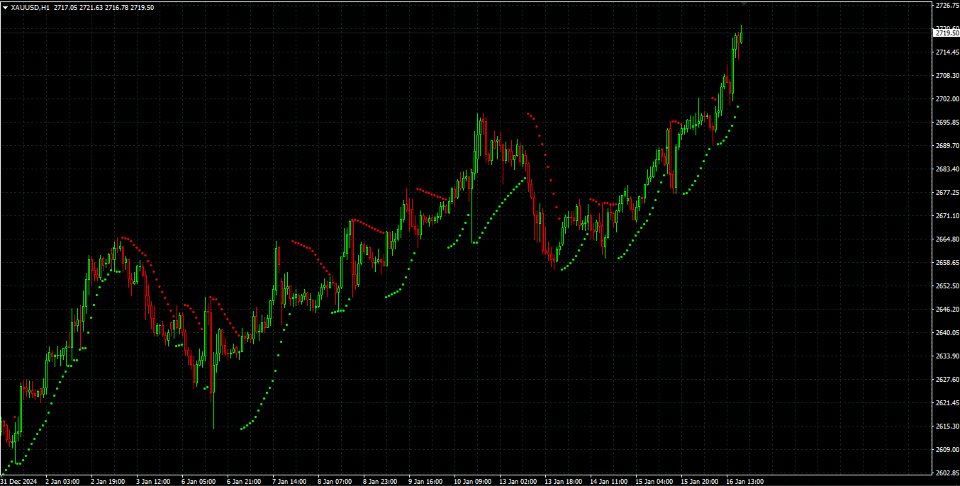
- Lime green "o" symbol for Buy signals.
- Red "o" symbol for Sell signals.
- Customizable Inputs:
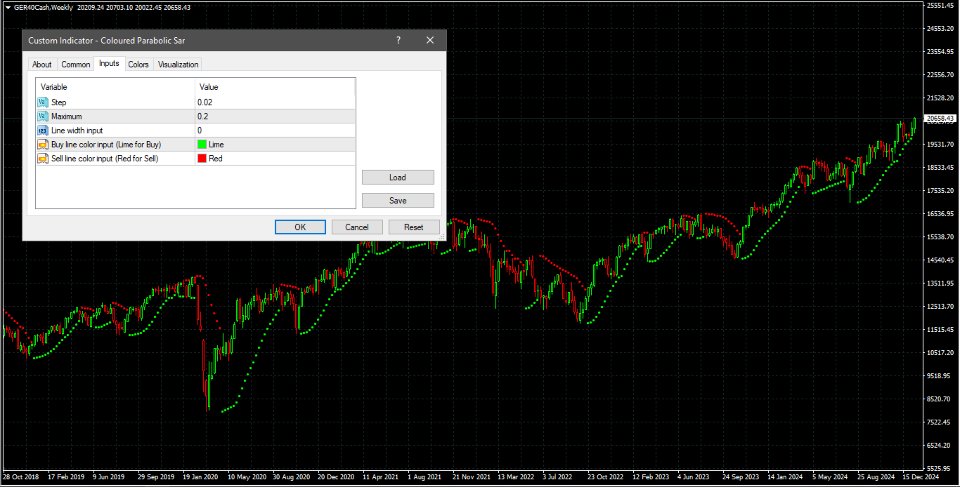
- Adjustable Step and Maximum parameters to fine-tune the Parabolic SAR calculation.
- Customizable line width and colors to suit your trading style and chart appearance.
- Simple and Effective Visualization:
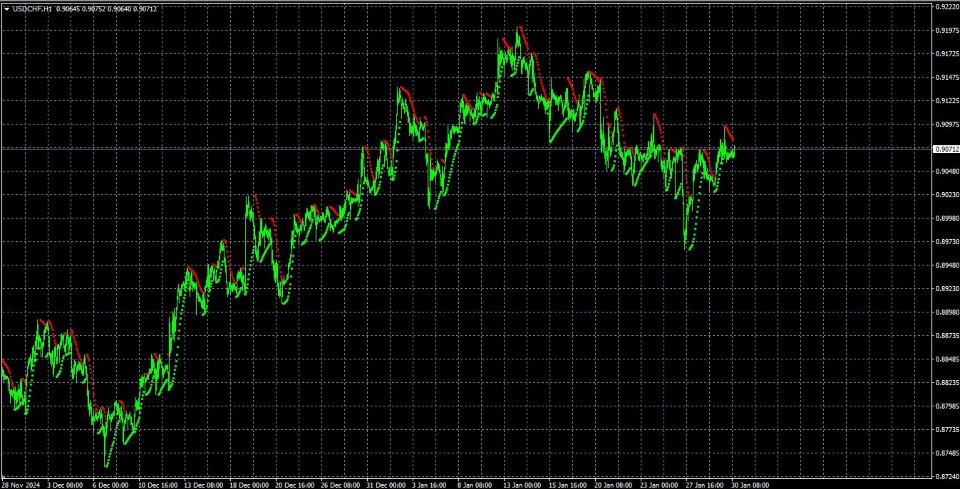
- Easily identify bullish and bearish trends with distinct symbols plotted above or below the price candles.
- Helps you quickly assess market conditions at a glance.
- Compatibility:
- Works on all MT4-supported symbols and timeframes.
Who Is It For?
- Traders looking for a straightforward way to incorporate the Parabolic SAR into their trading strategy.
- Ideal for trend-following strategies or as a confirmation tool alongside other indicators.
Inputs:
- Step: Defines the sensitivity of the Parabolic SAR (default: 0.02).
- Maximum: Sets the maximum value for the indicator (default: 0.2).
- Line Width: Adjust the thickness of the plotted signals.
- Line Color Up: Choose the color for bullish signals (default: Lime).
- Line Color Down: Choose the color for bearish signals (default: Red).
How It Works:
The indicator calculates the Parabolic SAR values for each candle and displays:
- Buy Signals: When the price closes above the SAR value, indicating a potential upward trend.
- Sell Signals: When the price closes below the SAR value, indicating a potential downward trend.
Why Choose This Indicator?
- Ease of Use: No clutter, just clear and concise signals.
- Customizable: Tailor it to match your trading needs and chart preferences.
- Versatility: Effective for scalpers, day traders, and swing traders alike.

