HTF Fair Value Gaps
- Göstergeler
- Felix Bitum
- Sürüm: 1.0
- Etkinleştirmeler: 5
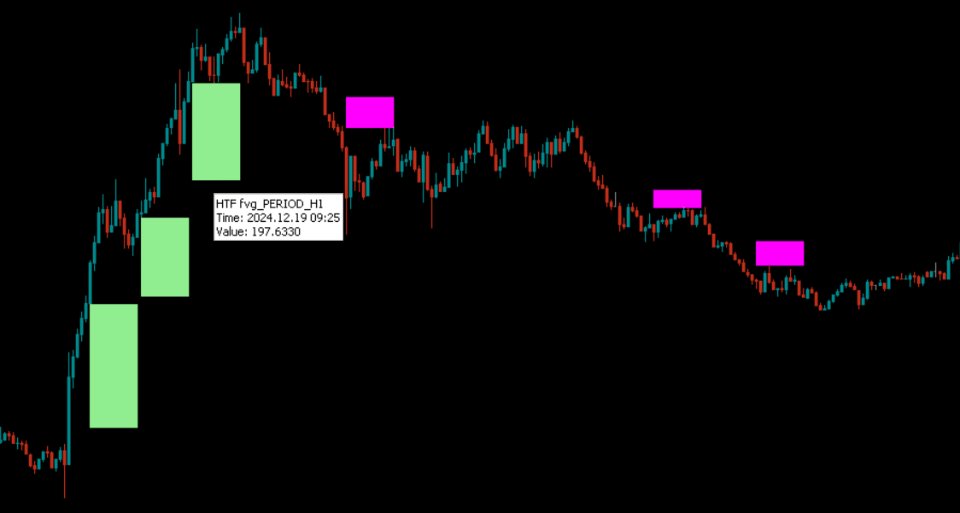
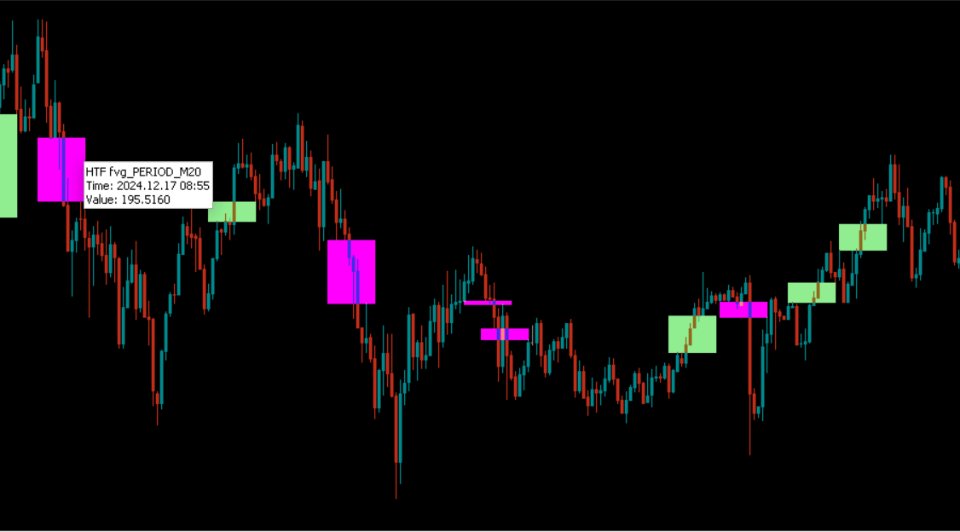
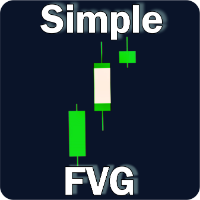
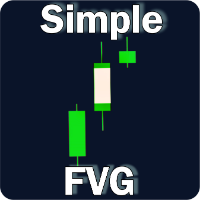
HTF Fair Value Gaps is an indicator which plots the bigger version of the higher time-frame Fair Value gaps on the lower time-frame chart. The indicator plots only fair value gaps from closed candles, with no lag or repainting. i.e. Once the higher time-frame candle has closed, if it left behind a fair value gap, it is immediately plotted on the lower time-frame.
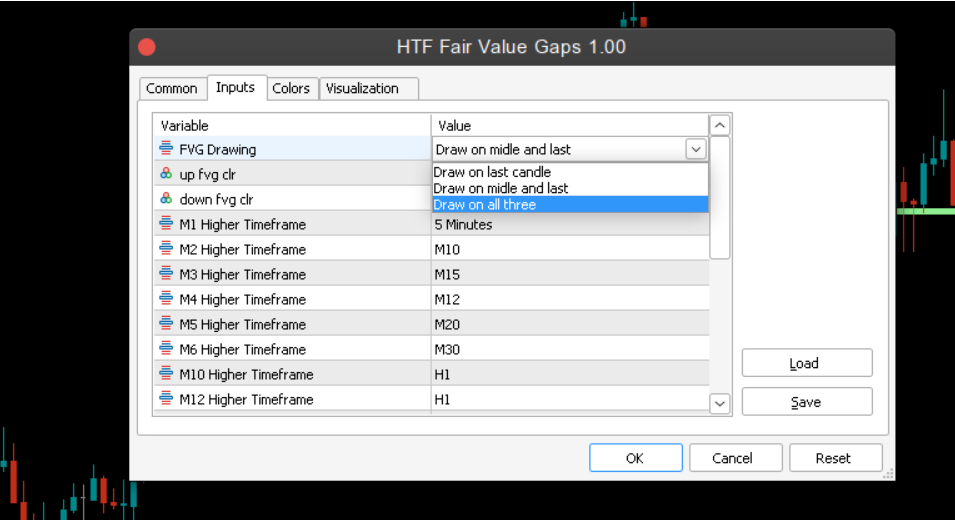
The FVGs can be plotted in three ways, which can be selected via input.
- Only on last candle: In this case the FVG will be plotted on top or below the respective HTF candle which caused it. this method ensures that the rectangle does not paint on any candle.
- On middle and last candle: In this method, the FVG is plotted across the last two candles which formed the FVG
- On all three: In this method, the FVG is plotted across all the three candles which made the FVG.
this is done to keep your chart simple, and make you make you free to choose.
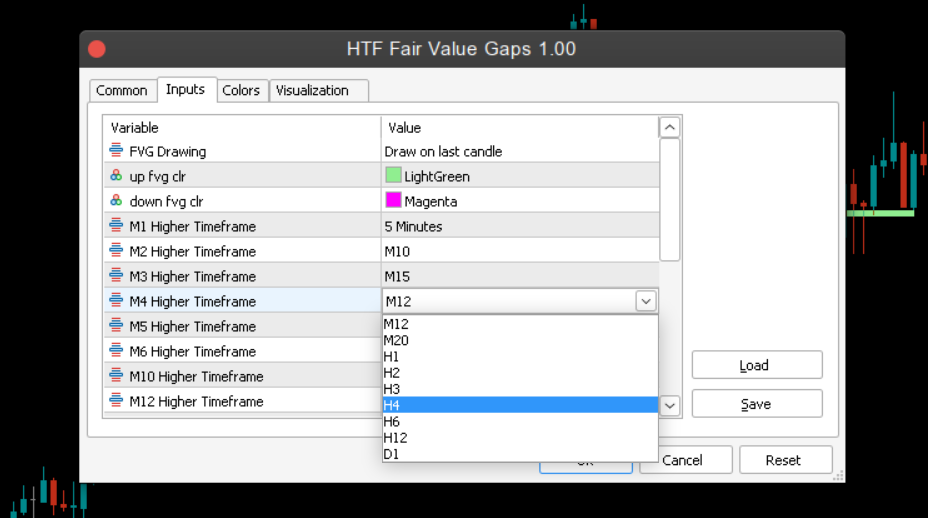
The indicator also allows you to choose different higher time-frames for each lower time-frame at the first loading of the indicator. That way, when you change from one time frame to another, the respective higher time-frame FVG will be displayed accordingly.
Features
- No objects drawn on chart: The indicator does not plot any lines or rectangle objects on the chart, it simply draws the htf candles. This keeps your chart simple and clean.
- Different Colors for FVG: You can choose the bearish or bullish HTF FVG accordingly
- MTF Selection: The indicator allows you to choose all the different higher time-frames for each lower period in one go, and goes changing accordingly.
- ON/OFF Toggle: The indicator has a feature which allows you to hide/show the HTF candles at any time with a keyboard shortcut of your choice which can be set via input.
Inputs Settings
| Input item | Description of values or settings |
|---|---|
| FVG Drawing | Choose whether to draw FVG accross all 3 HTF candles or ... |
| up fvg clr | Choose color for the bullish HTF FVG |
| down fvg clr | Choose color for the bearish HTF FVG |
| M1 Higher Time-frame | Choose the HTF FVG period to be displayed on M1 time-frame |
| M2 Higher Time-frame | Choose the HTF FVG period to be displayed on M2 time-frame |
| M3 Higher Time-frame | Choose the HTF FVG period to be displayed on M3 time-frame |
| M4 Higher Time-frame | Choose the HTF FVG period to be displayed on M4 time-frame |
| .... etc | Continue likewise for all the subsequent time-frames |
NOTE FOR STRATEGY TESTER
Please note that running the indicator on the strategy tester adds lines which go from the bottom of the terminal to the beginning of the bar. this is a bug within the tester itself.
The strategy tester also adds two lines up and below the candles, this line is like a moving average sort of... this is a bug within strategy tester itself.
the indicator only plots as shown in the images. No extra lines or funny things...
Future updates
More features will be added for this indicator in subsequent updates. The price will increase with each update, buy previous purchases will have benefit from all the new features in future updates at no cost.
In case you have any feature suggestions that you think should be added in the future release, please leave it in the comments. It will be looked into.
If you would like custom adjustments, EA or another indicator based on this, please feel free to contact me.
The MT4 Version can be got from here.
Please leave a review, and in case of any challenges feel free to send me a message on this platform.
All your opinions and comments are welcome.
Cheers..!
