Volume Impuls VSA
- Göstergeler
- Sergey Zhukov
- Sürüm: 1.1
- Güncellendi: 21 Kasım 2021
- Etkinleştirmeler: 5
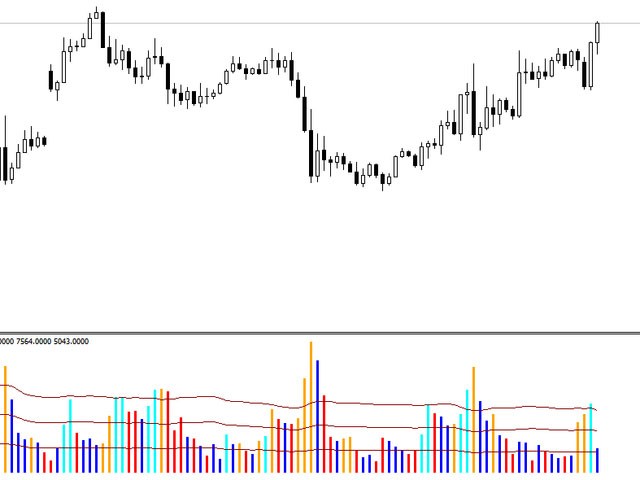
The Volume Impuls VSA indicator paints a histogram of volumes tading into account the bar direction and comparing it with the volume of previous bars. The volume of the rising and falling trend are painted respectively in blue and in red. If the current volume exceeds the volumes of the opposite direction, an impulse is formed. Accordingly, the impulse of the upward and downward trends are painted in blue and orange. Also the indicator displays three levels, based on which you can easily compare volumes. Analysis of the volume helps identify the current market trend. The indicator will be useful for traders who use the VSA method in trading. Using the indicator, you can easily determine possible rollback levels during the correction, as well as moments of trend beginning, end and reversal. Combination of Volume Impuls VSA with the ProfileVolumesMarket indicator of volume concentrations provides a powerful tool for volume based level trading.
Adjustable Parameters
- PeriodAutoFit - when set to "true" - period of levels for comparing indicator volumes 24 hours
- VSA_Period - period for calculating levels of indicator volume comparison in bars, if PeriodAutoFit = false
- ShowOfBars - indicator display history depth
