VWAP Histogram
- Göstergeler
- Richard Bystricky
- Sürüm: 1.1
- Etkinleştirmeler: 5
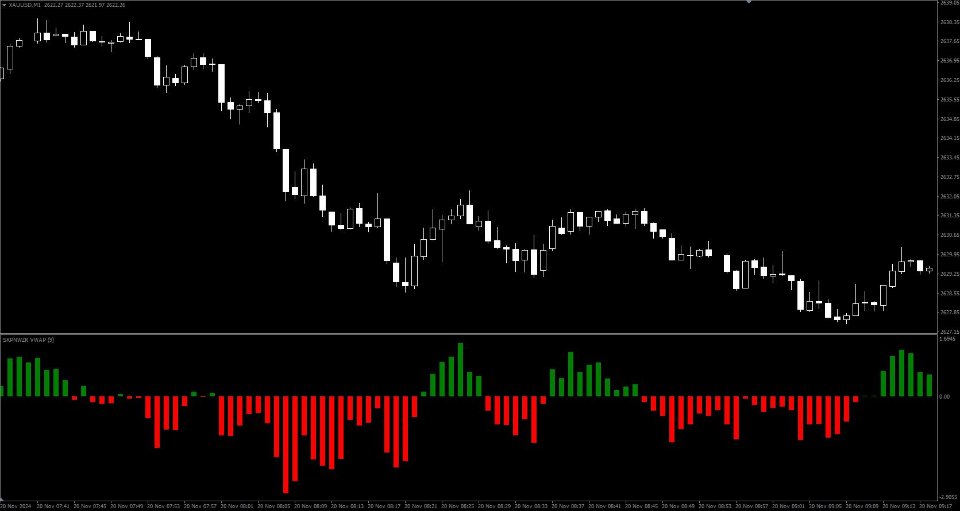
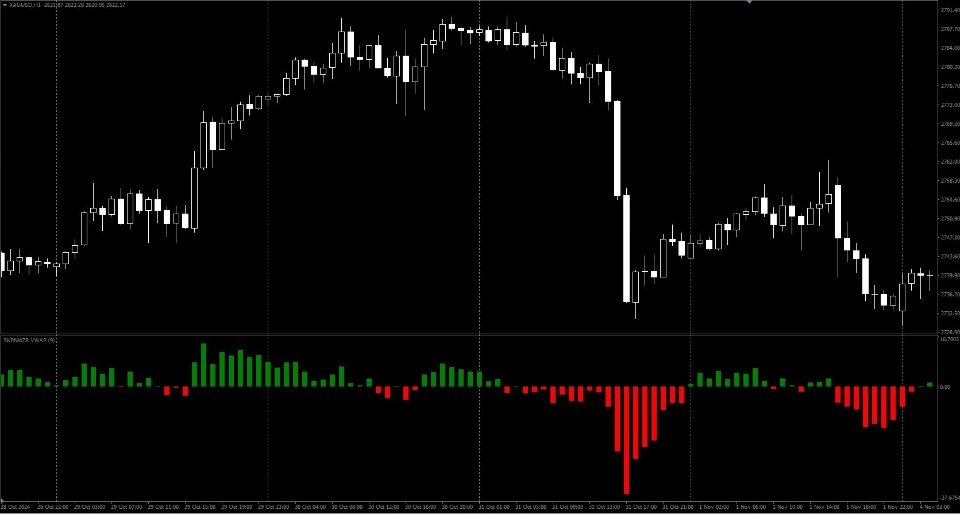
The VWAP Histogram Indicator is a powerful tool for traders, designed to visualize the Volume Weighted Average Price (VWAP) as a dynamic histogram. By combining VWAP with a clear histogram representation, this indicator provides deeper insights into price action and volume dynamics, helping traders identify key market levels more effectively.
Key Features:
- Histogram Representation: Displays VWAP as a histogram directly in the indicator window, offering an intuitive view of price deviations and volume strength.
- Customizable Periods: Configure the VWAP period to suit your trading strategy.
- Real-Time Updates: The histogram updates with every tick, ensuring precise and up-to-date information in fast-moving markets.
- Simple Configuration: Easy-to-use settings make the indicator suitable for both beginners and professional traders.
Why Use VWAP Histogram?
- Identify Trends: Gain a better understanding of price movements relative to VWAP.
- Support and Resistance: Spot key areas of support and resistance based on volume-weighted price data.
- Volume Analysis: Analyze market sentiment and pressure using volume dynamics visualized through the histogram.
Compatibility:
- Works seamlessly on all instruments, including Forex, commodities, indices, and stocks.
- Designed for MetaTrader 4
Enhance your trading strategy with the VWAP Histogram Indicator and gain a clear edge in analyzing market behavior!


