Fibonacci Volatility Bands
- Göstergeler
- Suvashish Halder
- Sürüm: 1.0
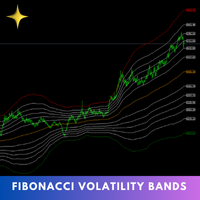
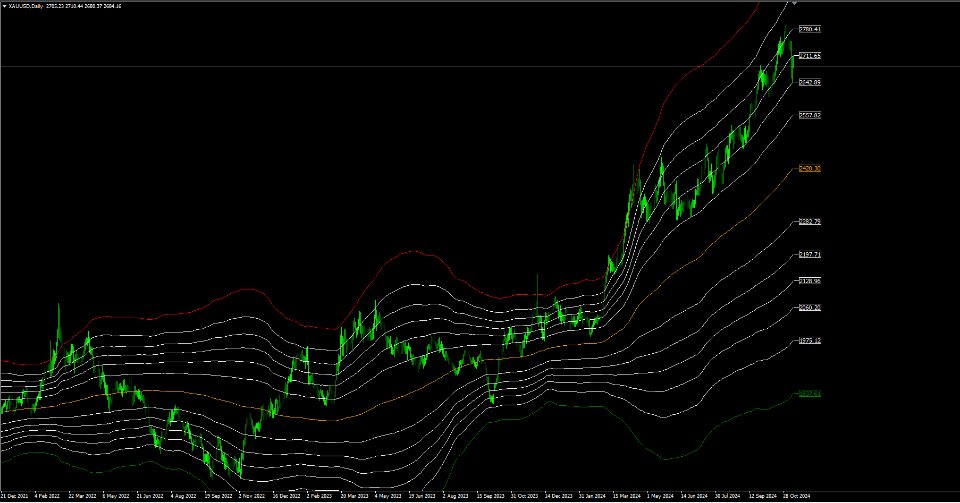
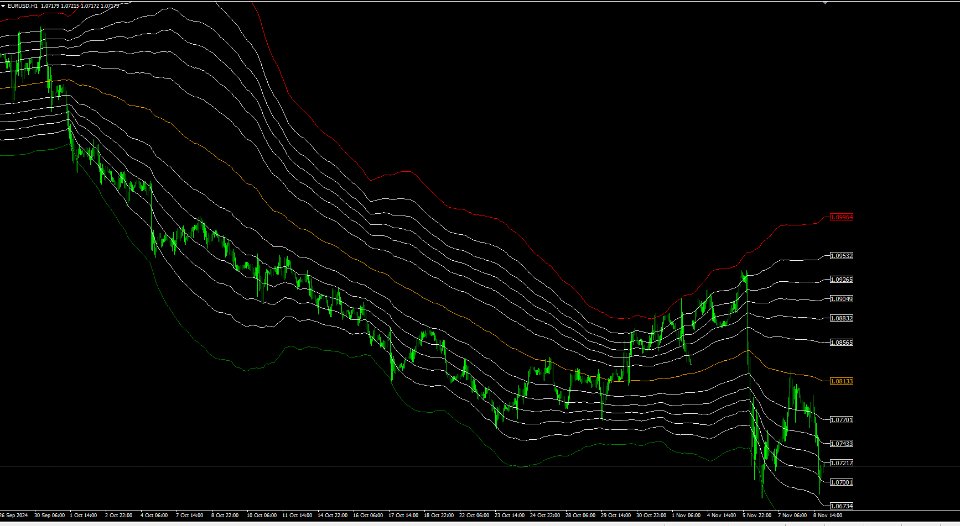
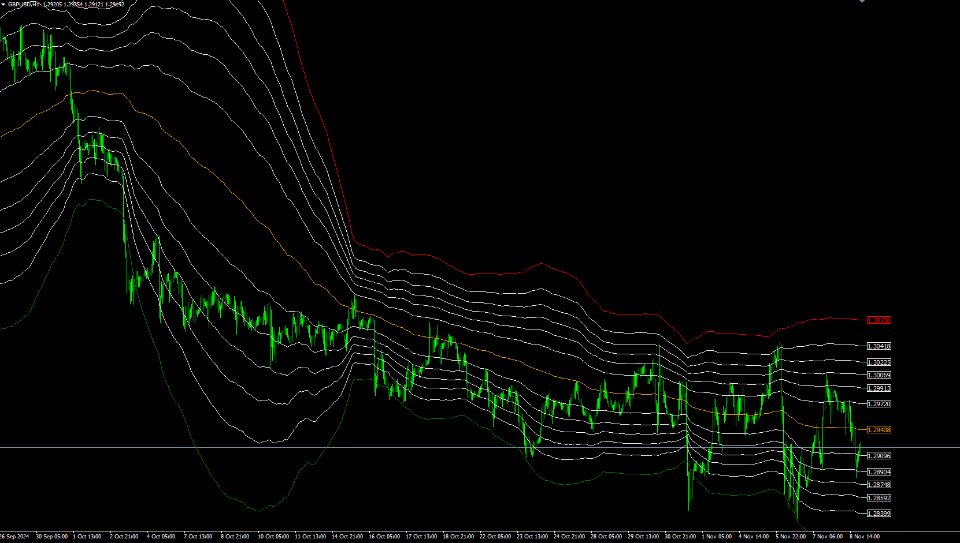
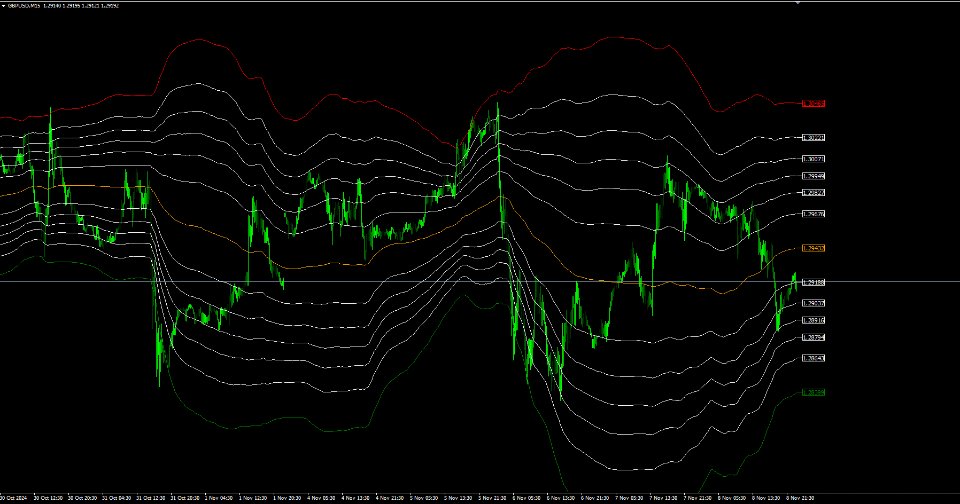
The Fibonacci Volatility Bands indicator is a refined tool designed to enhance your market analysis by integrating Fibonacci retracements with the Bollinger Bands concept. This indicator visually highlights potential areas of support and resistance, providing traders with a clearer understanding of price fluctuations and volatility.
MT5 Version - https://www.mql5.com/en/market/product/126422/
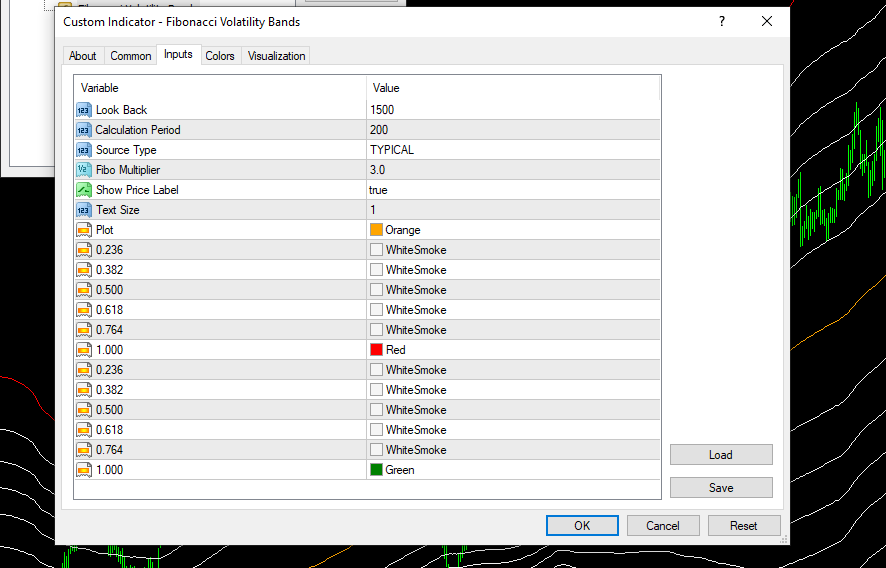
The core of the Fibonacci Volatility Bands is built around a Volume Weighted Moving Average (VWMA) that serves as the basis for calculation. By using VWMA, this indicator incorporates volume data to generate a more accurate and reliable representation of price movement, especially in high-volume market conditions. The bands are plotted at intervals of Fibonacci ratios (0.236, 0.382, 0.5, 0.618, 0.764, and 1), multiplied by a 3-standard-deviation value, creating dynamic boundaries that are both reactive to recent market activity and grounded in well-known Fibonacci levels.
These bands encapsulate approximately 99.73% of price action within the 3-standard-deviation range, providing a statistically significant window that captures most price movements. The Fibonacci-derived levels within this range are valuable as they reflect market psychology, highlighting zones where prices may find support or resistance.
Key Features:
- Volume Weighted Moving Average (VWMA) Basis: Offers a price basis that adjusts based on volume, providing a more responsive mean line compared to simple moving averages.
- Fibonacci Retracement Levels as Bands: Combines the predictive power of Fibonacci retracements (0.236, 0.382, 0.5, 0.618, 0.764, and 1) with traditional Bollinger Bands for refined support and resistance zones.
- 3-Standard-Deviation Coverage: Ensures that nearly all price action is accounted for within the outer bands, making it a reliable tool for volatility analysis.
- Visual Clarity: Distinct colors are used to highlight critical levels (0.236, 0.382, 0.5, 0.618, 0.764, and 1) with particular emphasis on upper and lower limits, helping traders quickly spot key price zones.
The Fibonacci Volatility Bands indicator is ideal for traders looking to harness the precision of Fibonacci retracement in conjunction with the predictive power of Bollinger Bands. With this tool, you can better anticipate market shifts, identify high-probability trade areas, and make more informed trading decisions.
Wishing you all the best and happy trading! Please note that support is not available for free products.
