Gold ScAIper MT5
- Uzman Danışmanlar
- Andrey Barinov
- Sürüm: 1.0
- Etkinleştirmeler: 5
Trading is easy, right? Detect the trend on a higher timeframe, wait for a pullback on a smaller timeframe and place a trade in the direction of the trend. Stick your SL and TP behind the current support and resistance levels. Enjoy the Profits!!! Welll, it is simple, but not easy.
Gold ScAIper does exactly that. It is a new generation trading robot which incorporates all cutting edge algorithms and technics in trend, pullbacks and support and resistance levels detection.
Gold ScAIper is not just EA. It is much more. Gold ScAIper is an ultimate trading station or Mission Control room powered by ChatGPT and Assistants from OpenAI.
No Grid
No Martingale
Good TP/SL ratio
FIFO compatible
Take advantage of the current launch promo price. I will increase the price with $100 increment after every 5 copies sold. The final price will be $1499.
Gold ScAIper for MetaTrader 4: https://www.mql5.com/en/market/product/126360
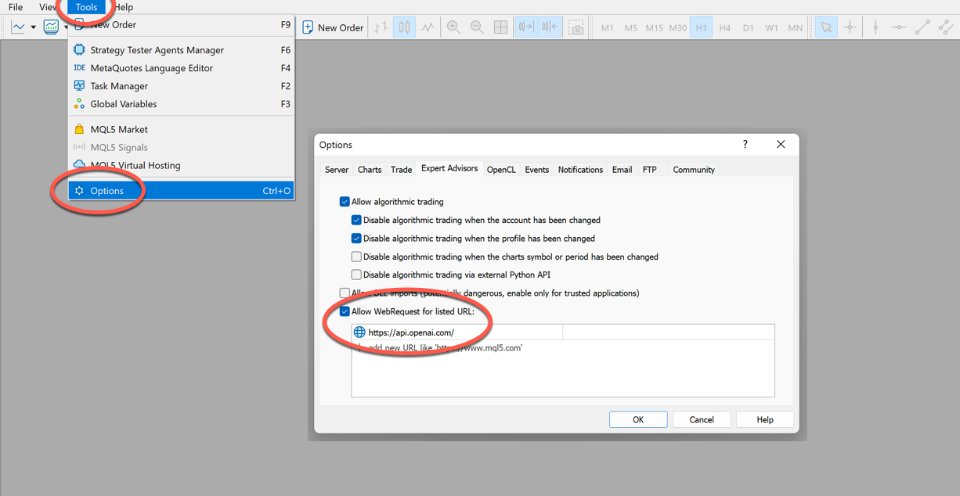
You have to allow webrequests to OpenAI resources in MetaTrader settings. See screenshots for more information.
Recommended Pairs and Balance
Gold ScAIper is designed for Gold exclusively.
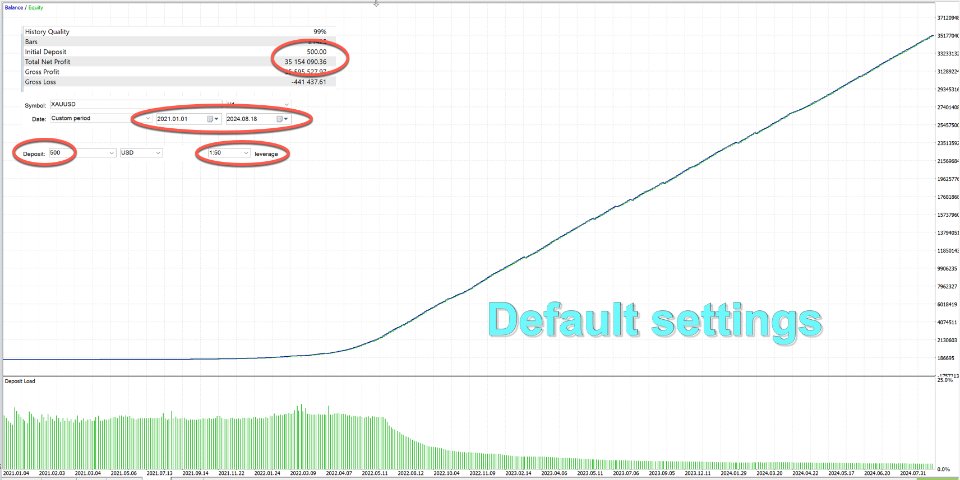
You can start with as small as $500-1000 with default settings..
Broker and Leverage
Gold ScAIper is not broker sensitive, you may chose any broker you trust to. The less the spread is, the better.
Recommended leverage is 1:100-1:500. 1:50 is also OK.
Time Frame
Trading performance does not depend on the timeframe. But, make sure that you have all timeframes data available in history center (F2).
I recoomend running the EA and backtests on M30 or H1 charts, for better visual representation.
VPS
Gold ScAIper can work on both VPS solution from MQL5 and regular VPS with desktop access. But to use all the GUI and AI capabilities you will need to access the desktop, so VPS from MQL5 is not recommended.
What to Expect
2-3 trades per week per pair, depending on the current market volatility and conditions.
There will be some losing trades among the wins.
Inputs
Risk Type- can be fixed risk per trade in money or % of Account Balance. You can also choose Fixed Lot Size.
Risk Value- depending on the Risk Type above, this would be either Risk in Money, % number or Fixed Lot value.
Recovery Aggression - Gold ScAIper has a built-in recovery algo. It will auto increase the lot after the losing trade to recover the loss. Lott is calculated dynamically. The bigger the recovery aggression parameter is set, the more aggressive lot increase happens. If set to 0, there will be no lot increase and all trades will be performed with Base Lot, as per settings above
Gold ScAIper AI ID # or Magic Number - specifies the name of the currently used Profile and also servs as a magic number. It should be set different for EVERY instance (with the same chart symbol) of EA running in your terminal.
Enable Trading Strategy - true / false parameter. Set it to "false" if you want to disable trading strategy and only use its GUI panels and dashboards.
Limitations
Not all countries / locations are allowed to access OpenAI resources. From some locations AI will not work. You can check if your location is allowed by trying to check ChatGPT on OpenAI website. If you can access this webpage https://chat.openai.com/ everything should work properly.
Additional Functionality
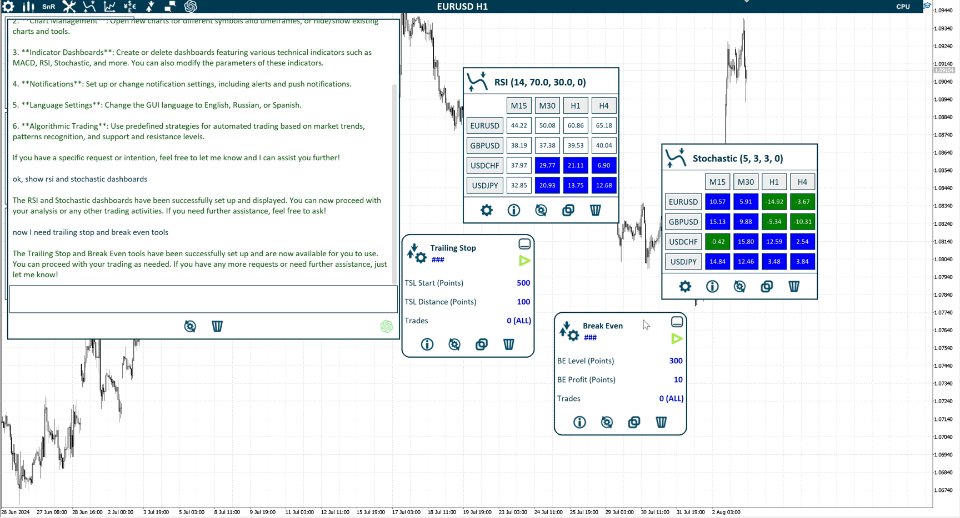
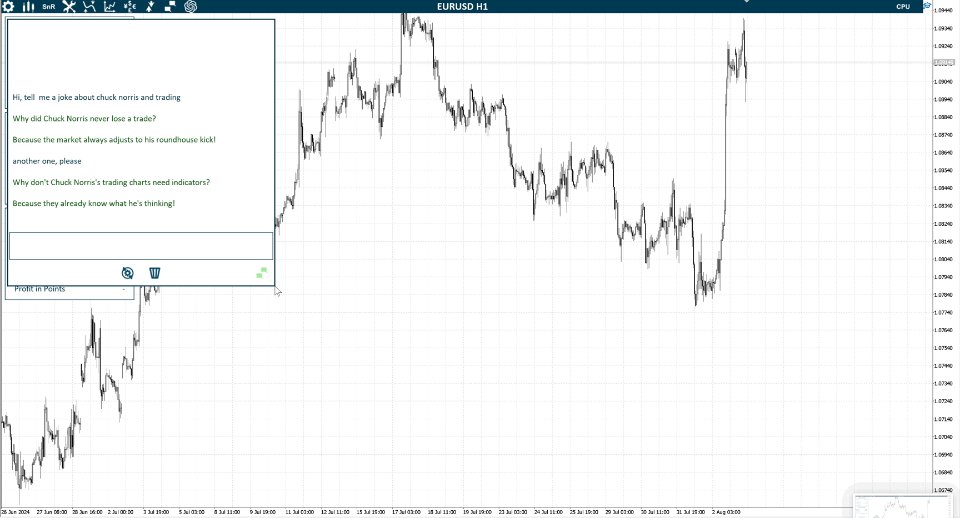
ChatGPT and OpenAI assistants. Chat gives a reply faster, but can really only be used for chatting. It can not execute any commands. Assistants are more powerful and can execute user commands, but it takes them longer to generate responses.
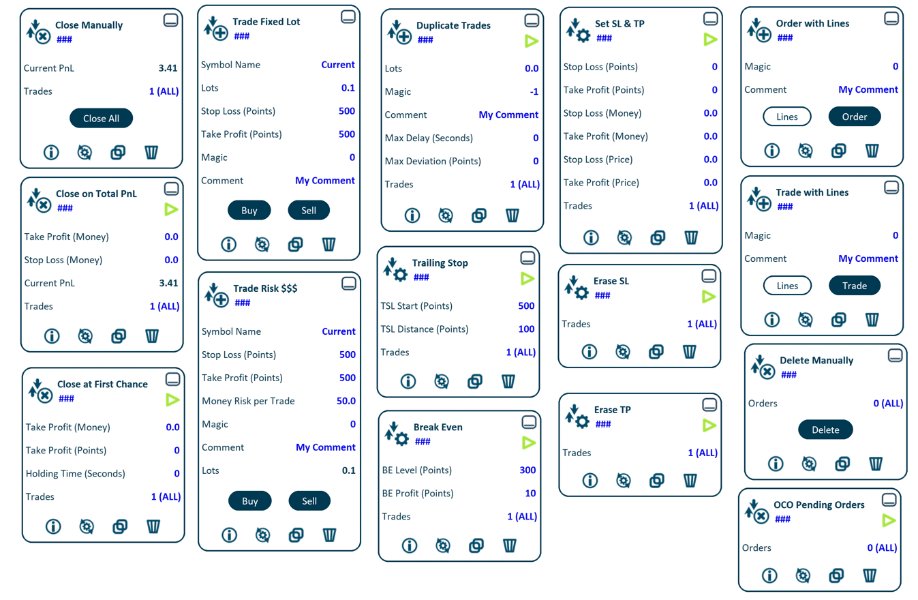
15+ Trading Tools for opening new trades and managing existing ones (check below for more details). More tools will come soon.
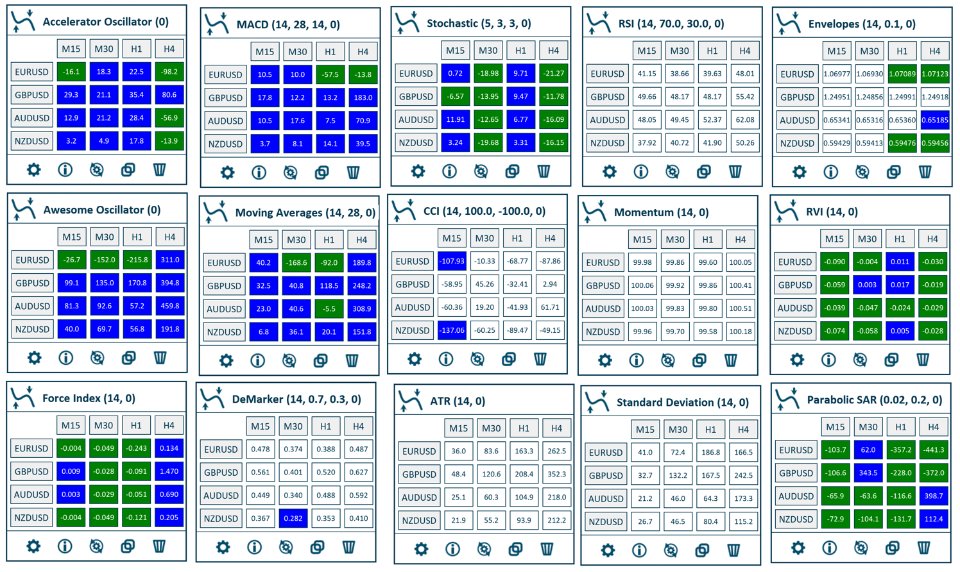
20+ Indicators dashboards showing multiple symbols and timeframes at once. They also show recommended buy/sell signals (check below for more details).
Support and Resistance Levels for a given chart may be shown and used for market analysis or to adjust SL and TP levels for your trades.
English, Spanish and Russian localizations.
Built-in descriptions for all tools and dashboards.
Available for both MetaTrader4 and MetaTrader5 platforms.
No need for you to register on OpenAI website or to have your own API keys. The tool works right from the box.
Tools
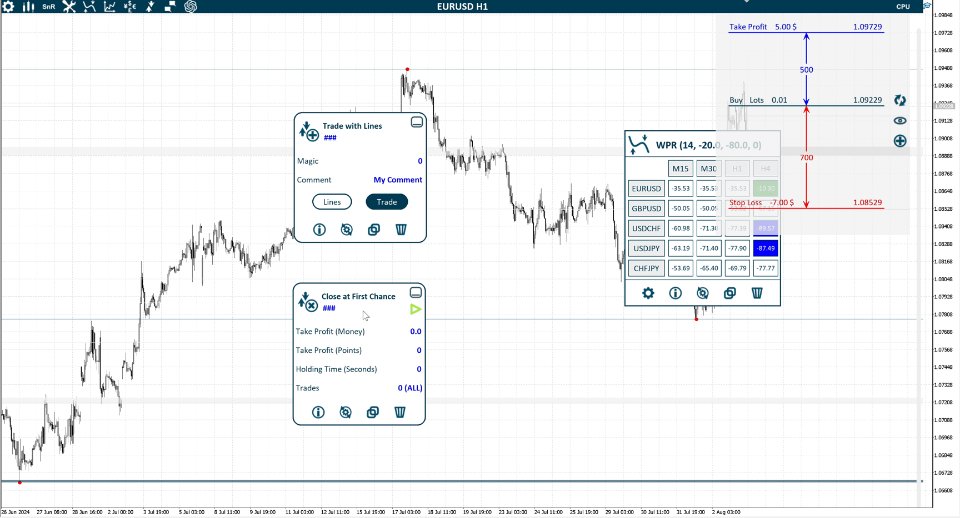
Trade with Lines and Pending Order with lines - allows adjusting trade's parameters using visual lines, before opening it. It can also calculate the lot size, based on given Stop Loss / Take Profit values in money.
Trade with Fixed Lot or Risk $ - Opens a trade with predefined parameters. Can trade any symbol or multiple symbols from a single chart. Automatically calculates the lot size using given Risk value in money and Stop Loss value in points.
Trades Duplicator - Duplicates selected incoming trades. Can be used as a signal duplicator. Can overwrite different parameters, including lot size, magic and comment. Allows setting maximum price deviation in points and maximum time delay in seconds.
Setting / Erasing Stop Loss and Take Profit - Allows setting Stop Loss and Take Profit for selected trades. Values can be set in points, money or as a fixed price level. Erase SL and TP utilities set SL / TP for selected trades as 0.
Trailing Stop and Break Even - classic functionality. But, with this tool you can set both TSL and BE INDIVIDUALLY for every trade.
Close on Total PnL - closes a group of trades when their total profit / loss reaches certain levels.
Close in Profit at First Chance - closes selected trades after certain holding time when they reach minimum profit levels, set in Money or Points.
One Cancels Others functionality for pending orders. Multiple orders can be selected. When / if one of them becomes triggered / turns into a trade, all other orders will be deleted.
Closing Trades and Deleting Pending Orders - manual closing of all selected trades / orders at once.
Dashboards
Accelerator Oscillator - Displays the value of AC indicator in points. Colored as buy signal if value is above 0 and as sell signal if it is below 0.
Awesome Oscillator - Displays the value of AO indicator in points. Colored as buy signal if value is above 0 and as sell signal if it is below 0.
Bulls Power - Displays the value of Bulls indicator in points. Colored as buy signal if value is above 0 and as sell signal if it is below 0.
Bears Power - Displays the value of Bears indicator in points. Colored as buy signal if value is above 0 and as sell signal if it is below 0.
MACD - Displays the difference between Main Line and Signal Line in points. Colored as buy signal if Main Line is above Signal Line and as sell signal if it is below.
Moving Averages - Displays the difference between Fast MA and Slow MA in points. Colored as buy signal if Fast MA is above Slow MA and as sell signal if it is below.
Stochastic - Displays the difference between Main Line and Signal Line. Colored as buy signal if Main Line is above Signal Line and as sell signal if it is below.
CCI - Displays the value of CCI indicator. Colored as buy signal if value is below Oversold Level and as sell signal if it is above Overbought Level.
WPR - Displays the value of WPR indicator. Colored as buy signal if value is below Oversold Level and as sell signal if it is above Overbought Level.
RSI - Displays the value of RSI indicator. Colored as buy signal if value is below Oversold Level and as sell signal if it is above Overbought Level.
Momentum - Displays the value of Momentum indicator.
Envelopes - Displays the value of Middle Envelopes Line. Colored as buy signal if Close Price is above Upper Line and as sell signal if Close Price is below Lower Line.
Bollinger Bands - Displays the value of Middle Bollinger Bands Line. Colored as buy signal if Close Price is above Upper Line and as sell signal if Close Price is below Lower Line.
RVI - Displays the difference between Main Line and Signal Line. Colored as buy signal if Main Line is above Signal Line and as sell signal if it is below.
Money Flow Index - Displays the value of MFI indicator. Colored as buy signal if value is below Oversold Level and as sell signal if it is above Overbought Level.
Force Index - Displays the value of Force indicator. Colored as buy signal if value is above 0 and as sell signal if it is below 0.
DeMarker - Displays the value of DeMarker indicator. Colored as buy signal if value is below Oversold Level and as sell signal if it is above Overbought Level.
ATR - Displays the value of Average True Range indicator in points.
Standard Deviation - Displays the value of StdDev indicator in points.
Parabolic SAR - Displays the difference between High/Low price and PSAR value in points. Colored as buy signal if PSAR dot is below candle and as sell signal if it is above candle.
Future Development
I am planning to further develop this project using my own ideas and valuable inputs / feedback from the users.
Please, do let me know if you have any comments or requests which can help make this product even better. I am listening.
About me
I am a professional developer with 12+ years of MQL programming experience and 1000+ performed job orders as a freelancer.
Now my full time job is to create professional solutions for traders.

