ADX Signal AM
- Göstergeler
- Andriy Matviyevs'kyy
- Sürüm: 30.0
- Güncellendi: 14 Mart 2025
This indicator is an interpretation of the Average Directional Movement Index (ADX), which helps to determine the presence of a price trend.
It was developed and described in detail in the book "New Concepts in Technical Trading Systems" by Welles Wilder.
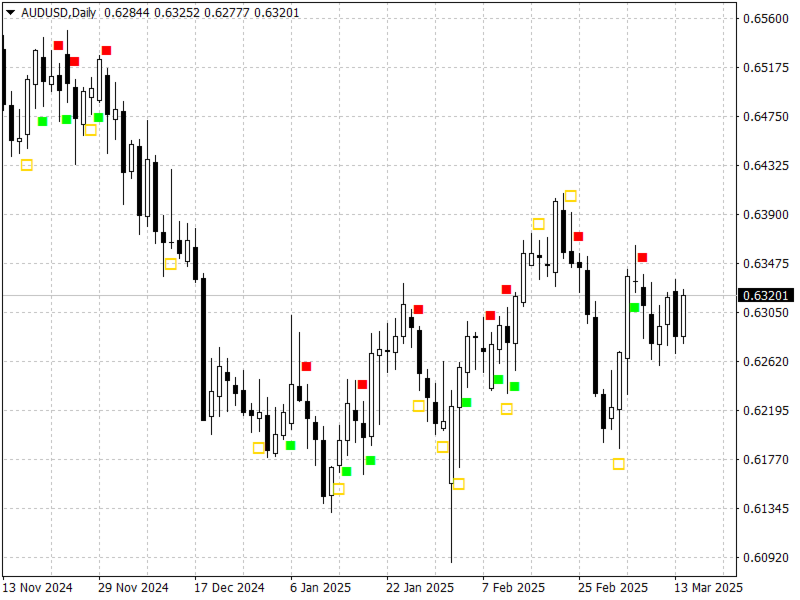
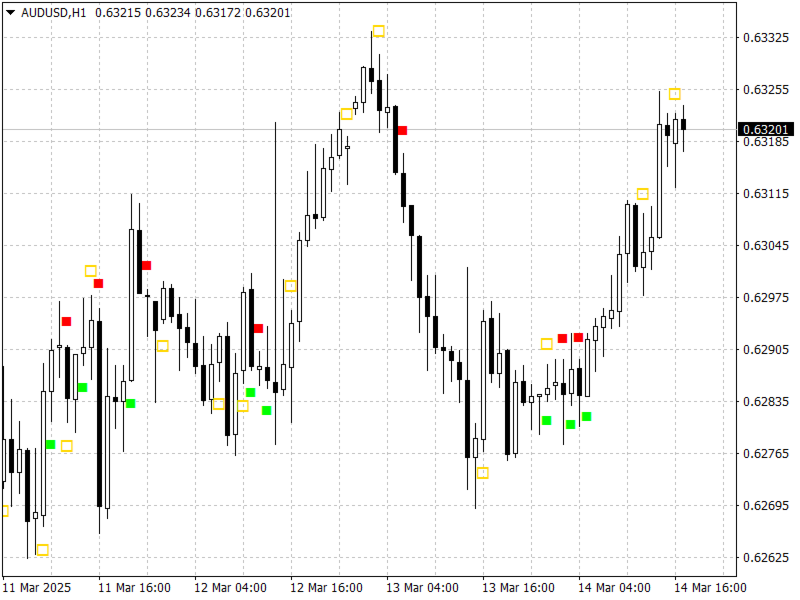
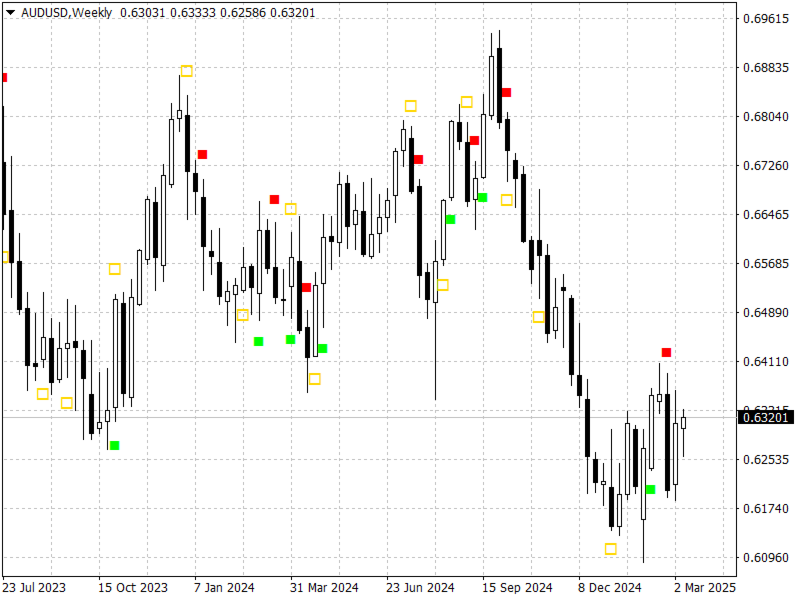
The presented indicator displays signals on the price chart when +DI and -DI cross and signals when the ADX value falls or rises in relation to the mutual arrangement of +DI and -DI.
The indicator's buy signals also work as a support level, while sell signals work as a resistance level.
Principles of use:
- When a signal of +DI and -DI cross appears, a pending order to buy or sell the asset should be set at the maximum or the minimum of the bar on which this signal appeared.
- When a signal of ADX falling appears in the presence of an open position, a pending order to close the position should be set at the maximum or the minimum of the bar on which this signal appeared.
- It can also be effective to use the ADX growth/fall signal in the direction of the long-term trend to open a position.
Configurable indicator parameters:
- ADX_Period - the ADX indicator period;
- ADX_Price - the price for calculating ADX;
- Intersection_of_the_DMIp_DMIm - the indicator signals when +DI and -DI cross;
- Height_ADX - the indicator signals when ADX grows;
- Falling_ADX - the indicator signals when ADX falls;
- Distance - the distance between the indicator signal and the price chart;
- Alerts - the indicator displays a dialog box containing user data;
- Send_Mail - the indicator sends an email to the address specified in the settings window on the "Mail" tab;
- Send_Notification - the indicator sends a notification to mobile terminals whose MetaQuotes ID is specified in the settings window on the "Notifications" tab.
Attention:
Please note that any market is constantly changing and there is no guarantee that methods that have been effective in the past will show the same results in the future.
You should not use maximum risk indicators in real trading that have shown the best results in the past.
To minimize potential losses, you should regularly optimize the product parameters, study the results of its work and withdraw part of the profit received.
It is recommended that before using the product on a real account, you test its work on a demo account in the same market and with the same broker where you plan to trade.
With respect and best wishes,
Andriy Matviyevs'kyy
P.S.
If you liked this product, I would be grateful for a fair assessment - positive user reviews motivate the author, and reasonable criticism allows us to make products better.
I suggest visiting my page where you will find many unique author's works that are the result of many years of studying exchange trading and FOREX trading.

amazing indicator!