AutoTrend Lines
- Göstergeler
- Murad Nagiev
- Sürüm: 1.0
Automatic Trendline Indicator
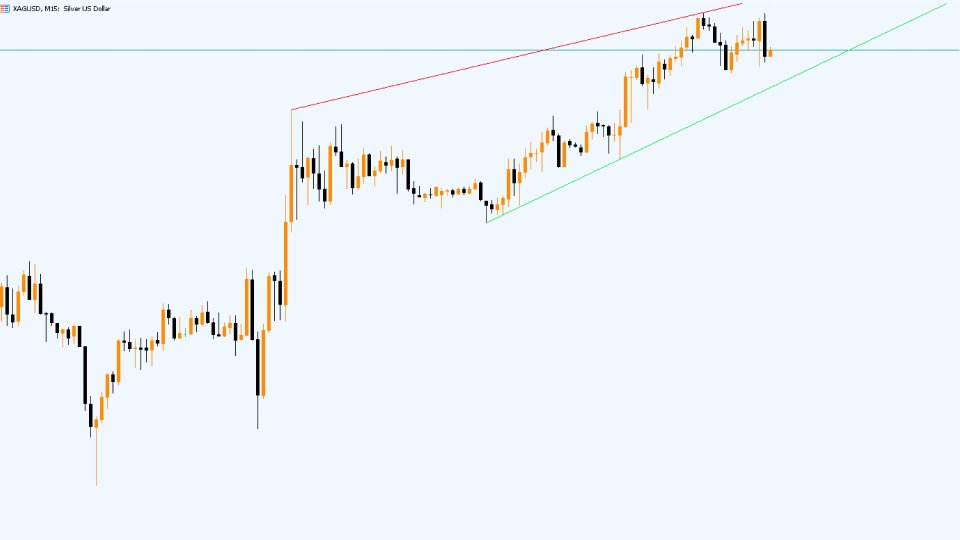
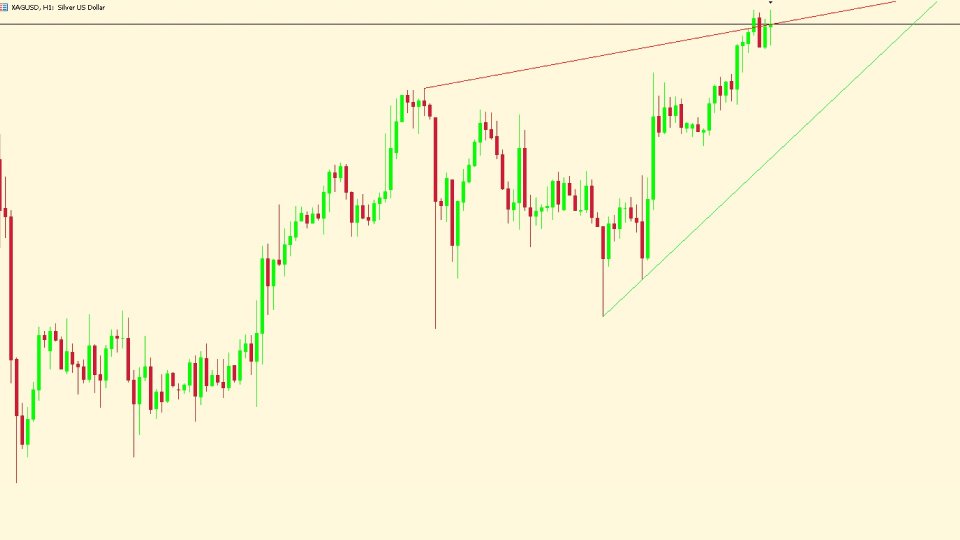
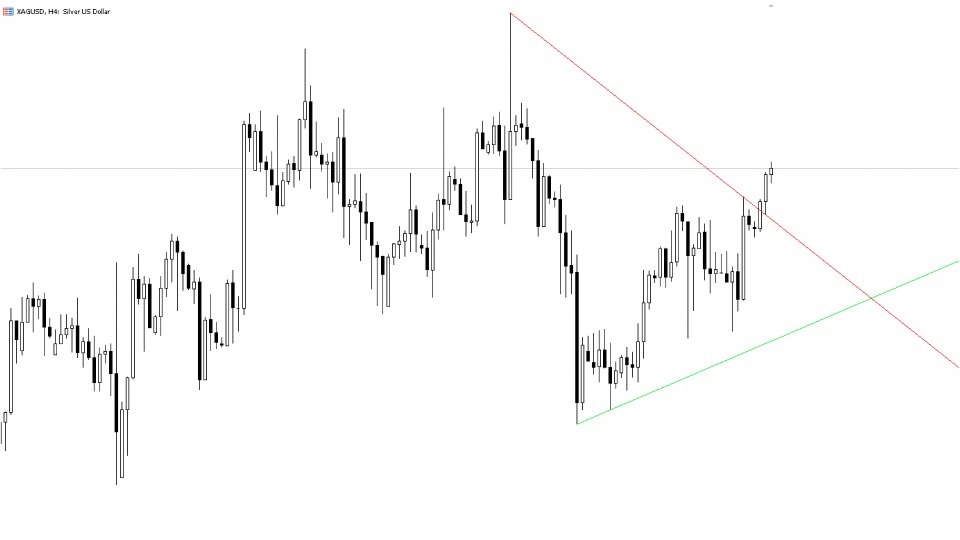
The Automatic Trendline Indicator is a powerful tool designed to simplify technical analysis by automatically identifying and drawing trendlines on a price chart. It analyzes price movements to detect key support and resistance levels, plotting ascending and descending trendlines based on historical price action. This indicator helps traders identify market trends, potential breakout points, and reversal areas with minimal effort.
Key features:
- Automatic Detection: No need for manual drawing; trendlines are plotted automatically.
- Support and Resistance: Highlights key levels where price frequently reacts.
- Customizable Settings: Adjust sensitivity, timeframe, and other parameters to suit different trading strategies.
- Multi-Timeframe Support: Works across different timeframes for a broader analysis.
This indicator is suitable for traders of all levels looking for a clear, visual representation of market trends to make more informed trading decisions


