
Ne yazık ki, "Color MA with Candles" kullanılamıyor
Pieter Gerhardus Van Zyl yazarının diğer ürünlerine göz atabilirsiniz:
The indicator provides buy and sell arrows with a moving average
# Added color change to the moving average and added ema bars
The arrows are based on a reversal algorithm - Different than my other indicator MA with Arrows that is continuation based
Only buy arrows are shown above the moving average and only sell arrows are shown below the moving average - Where the candle closes
Alerts can be activated as preferred
Suitable to any timeframe or instrument of choice
Please test in de

The indicator is a histogram for scalping the lower timeframes
When the hill behind appears go short and when it disappears go long
The indicator has only sound alerts
The colors can be adjusted as preferred
Suitable for lower timeframes - 1 - 5 minutes
Test in demo before purchase
Enjoy -----------------------------------------------------------------------

The indicator is a double Rsi based histogram.
The coloring can repaint one bar backwards because of smoothing but still gives early signals
Check out my indicator - Pullback Arrows - https://www.mql5.com/en/market/product/123506
The values and colors can be changed as preferred.
Green bullish and red bearish
Symbol: Any Timeframe: Any
Enjoy! -----------
FREE
Girişlere yardımcı olmak için yeniden boyanmayan bir ok göstergesi Trend olan piyasalarda daha iyi sinyaller veriliyor Oku yerine kilitlemek için mevcut çubuğun kapanmasını bekleyin Kafanızı karıştıracak hiçbir ayar olmadan sadece grafiği yükleyin Okun rengi ve boyutu ayarlanabilir Gösterge herhangi bir çift veya herhangi bir zaman diliminde kullanılabilir - Forex, kripto ..... Daha büyük zaman dilimi trendiyle ticaret yapmak daha iyi -------------------------------------------------- ---------

The indicator is a T3 and Rsi based oscillator with color change.
The indicator repaints.
Check out my indicator - Pullback Arrows - https://www.mql5.com/en/market/product/123506
The values and colors can be changed as preferred.
Please play around with the settings to get better signals.
The fast line gives earlier signals but if you want confirmation wait for the cross or slow line to change color also.
Buy when lines is closer to the 20 line and sell closer to the 80 line.
Sym
FREE
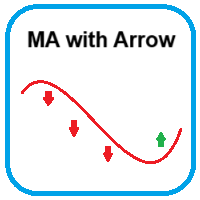
The indicator provides a moving average with buy and sell arrows
Only buy arrows are shown above the moving average and only sell arrows are shown below the moving average
The moving average can be adjusted as preferred - Default is 200 EMA
The arrows is non repaint after close of candle to lock it in place
The arrows also has alerts if needed
Suitable to any timeframe or instrument of choice
Test in demo before purchase
Enjoy

The indicator is a double Rsi based oscillator with color change.
The coloring sometimes repaints because of smoothing.
Check out my indicator - Pullback Arrows - https://www.mql5.com/en/market/product/123506
The values and colors can be changed as preferred.
The fast line gives earlier signals but if you want confirmation wait for the cross or slow line to change color also.
Buy when lines is closer to the 20 line and sell closer to the 80 line.
Symbol: Any Timeframe: Any
Enjo
FREE

The indicator is a simple bar oscillator with green and red bars
The calculation of the bars are Rsi based
The values of the bars does not recalculate after bar has closed
Higher green bars shows possible bullish momentum and vice versa
The indicator has no settings or alerts
The colors can be adjusted as preferred but the bar width should remain on default
Suitable for any timeframe or instrument
Test in demo before purchase
Enjoy ----------------------------------------------

The indicator provides arrows and 2 moving averages
The arrows is based on T3 and only shows bullish arrows above both moving averages and vice versa - Where candle closes
The moving average shows color change based on slope
I didn't add alert because to many arrows
Suitable for any timeframe and symbol
Please test extensively in tester before purchase!
Enjoy! ----------------------
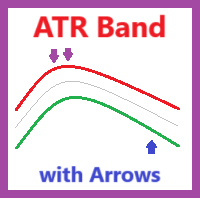
The indicator is an ATR band with 2 types of arrows
Band arrows are given when price reaches outside the band
The smaller arrows are MA crossover arrows
Arrows do repaint after refreshing or reloading chart
Not suitable for trending market, as it will give false signals!!!
Usable on any timeframe and symbol
___________________________________________________________
Please test in tester before purchase

The indicator is a very simple oscillator based on T3
Green and red bars shows bullish or bearish direction
Also above and below the zero line can show sentiment
The T3 value and price can be adjusted according to your trading style
The colors can also be changed as preferred
Please test in tester before purchase
Enjoy!!! ---------------------------------