• Genel bakış
  • İncelemeler
  • Yorumlar
  • Yenilikler

Vondereich MTF Strenght

Vondereich MTF Strength Indicator

Description:

Overview: The Vondereich MTF Strength Indicator is a powerful yet user-friendly multi-timeframe analysis tool designed to simplify market insights for traders of all experience levels. By evaluating currency pairs across various timeframes using a combination of technical indicators such as the Stochastic Oscillator, Relative Strength Index (RSI), Exponential Moving Average (EMA), and Average True Range (ATR), this indicator delivers clear buy, sell, or neutral recommendations to help traders make informed decisions effortlessly.

Key Features:

  1. Multi-Timeframe Analysis: Analyzes up to 9 different timeframes (M1 to MN1) simultaneously, providing a comprehensive view of market trends and strengths across all time horizons.
  2. Advanced Strength Calculation: Combines Stochastic, RSI, and EMA signals with dynamically adjusted thresholds based on market volatility to identify strong or weak trends, ensuring accurate market readings.
  3. Clear and Actionable Recommendations: Offers straightforward buy or sell recommendations with specific entry, stop-loss, and take-profit levels, making it easy to execute trades with confidence.
  4. Customizable Alerts and Visuals: Displays color-coded strength levels, trend directions, and actionable recommendations directly on the chart, while optional push notifications keep you informed of key market movements in real time.
  5. User-Friendly Interface: Intuitive design with a well-organized strength panel and recommendation panel, allowing traders to effortlessly monitor and interpret market signals.
  6. Easy to Use: Simply monitor the data provided by the indicator. No complex setups or configurations required—ideal for traders who want quick and reliable market insights at a glance.

Ideal for All Traders: Whether you are a beginner or an experienced trader, the Vondereich MTF Strength Indicator adapts to your trading style, providing essential insights for both short-term and long-term strategies without the need for constant monitoring or manual analysis.

How It Works: The indicator calculates the strength of a currency pair across multiple timeframes by evaluating key technical indicators. Based on the aggregated data, it categorizes the market into Strong Buy , Strong Sell , or Neutral conditions and provides detailed trading suggestions accordingly. This helps traders identify optimal entry and exit points, thereby enhancing their trading performance.

Compatible Symbols: Optimized for major currency pairs like EURUSD, GBPUSD, USDJPY, XAUUSD, and many more.

Enhance Your Trading Strategy with the Vondereich MTF Strength Indicator—Easy to Use and Highly Effective!


How to Use the Vondereich MTF Strength Indicator

The Vondereich MTF Strength Indicator is designed for ease of use, allowing traders to quickly interpret market signals and make informed trading decisions. Below are step-by-step instructions to help you get started and utilize the indicator effectively:

1. Installation:

  • Download the Vondereich MTF Strength Indicator from the MQL5.com market.
  • Open your MetaTrader 4 (MT4) platform.
  • Go to the Navigator panel and click on the Indicators section.
  • Drag and drop the Vondereich MTF Strength Indicator onto your desired chart.
  • Adjust the settings as needed in the input parameters window, or use the default settings.

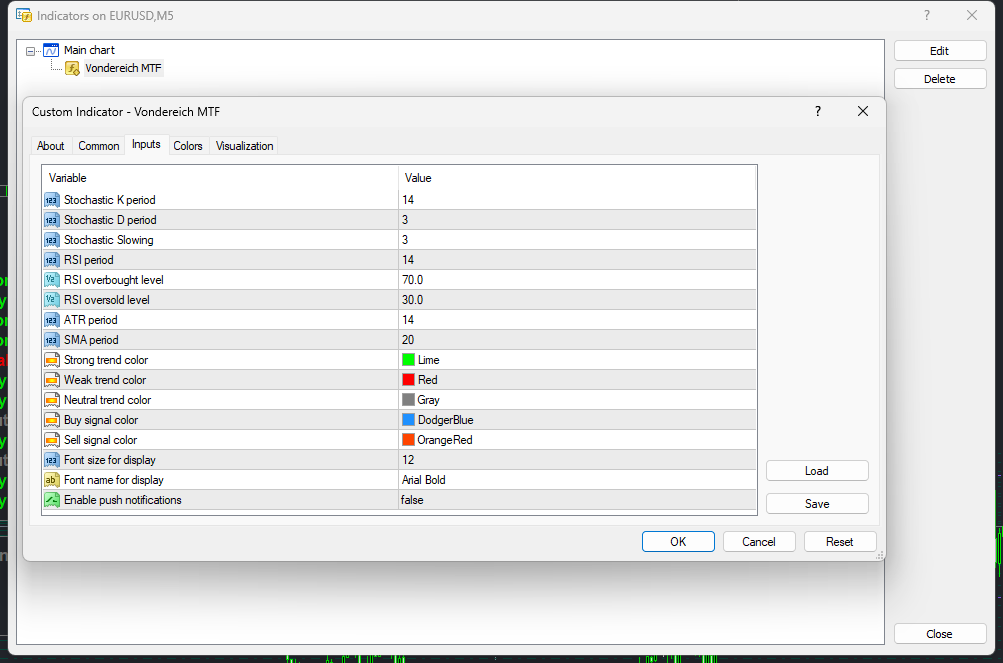
2. Configuring Input Parameters:

  • Stochastic Oscillator Settings: Adjust StochKPeriod , StochDPeriod , and StochSlowing based on your preferred configuration for the Stochastic Oscillator.
  • RSI Settings: Modify the RSIPeriod , RSIOverboughtLevel , and RSIoversoldLevel to customize the Relative Strength Index (RSI) thresholds.
  • EMA and ATR Settings: Configure the EMAPeriod for the Exponential Moving Average and the ATRPeriod for the Average True Range indicator according to your strategy.
  • Display Settings: Choose colors and font sizes for a personalized display on your chart.

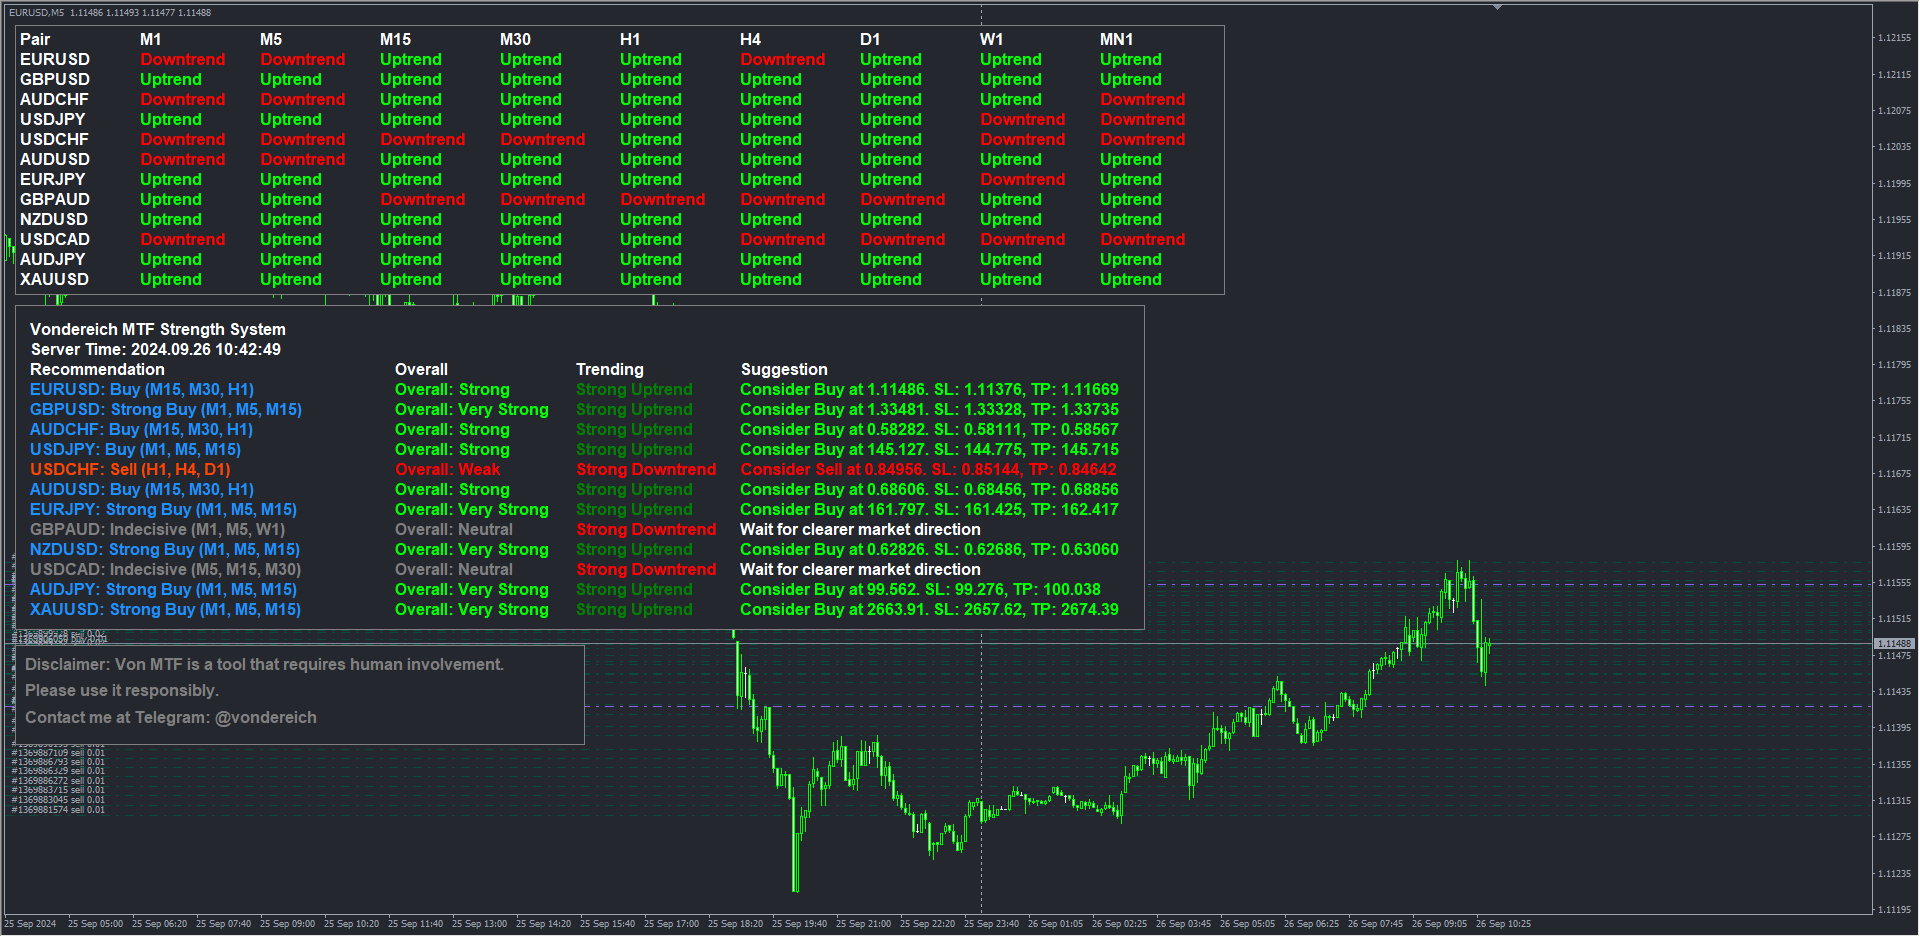
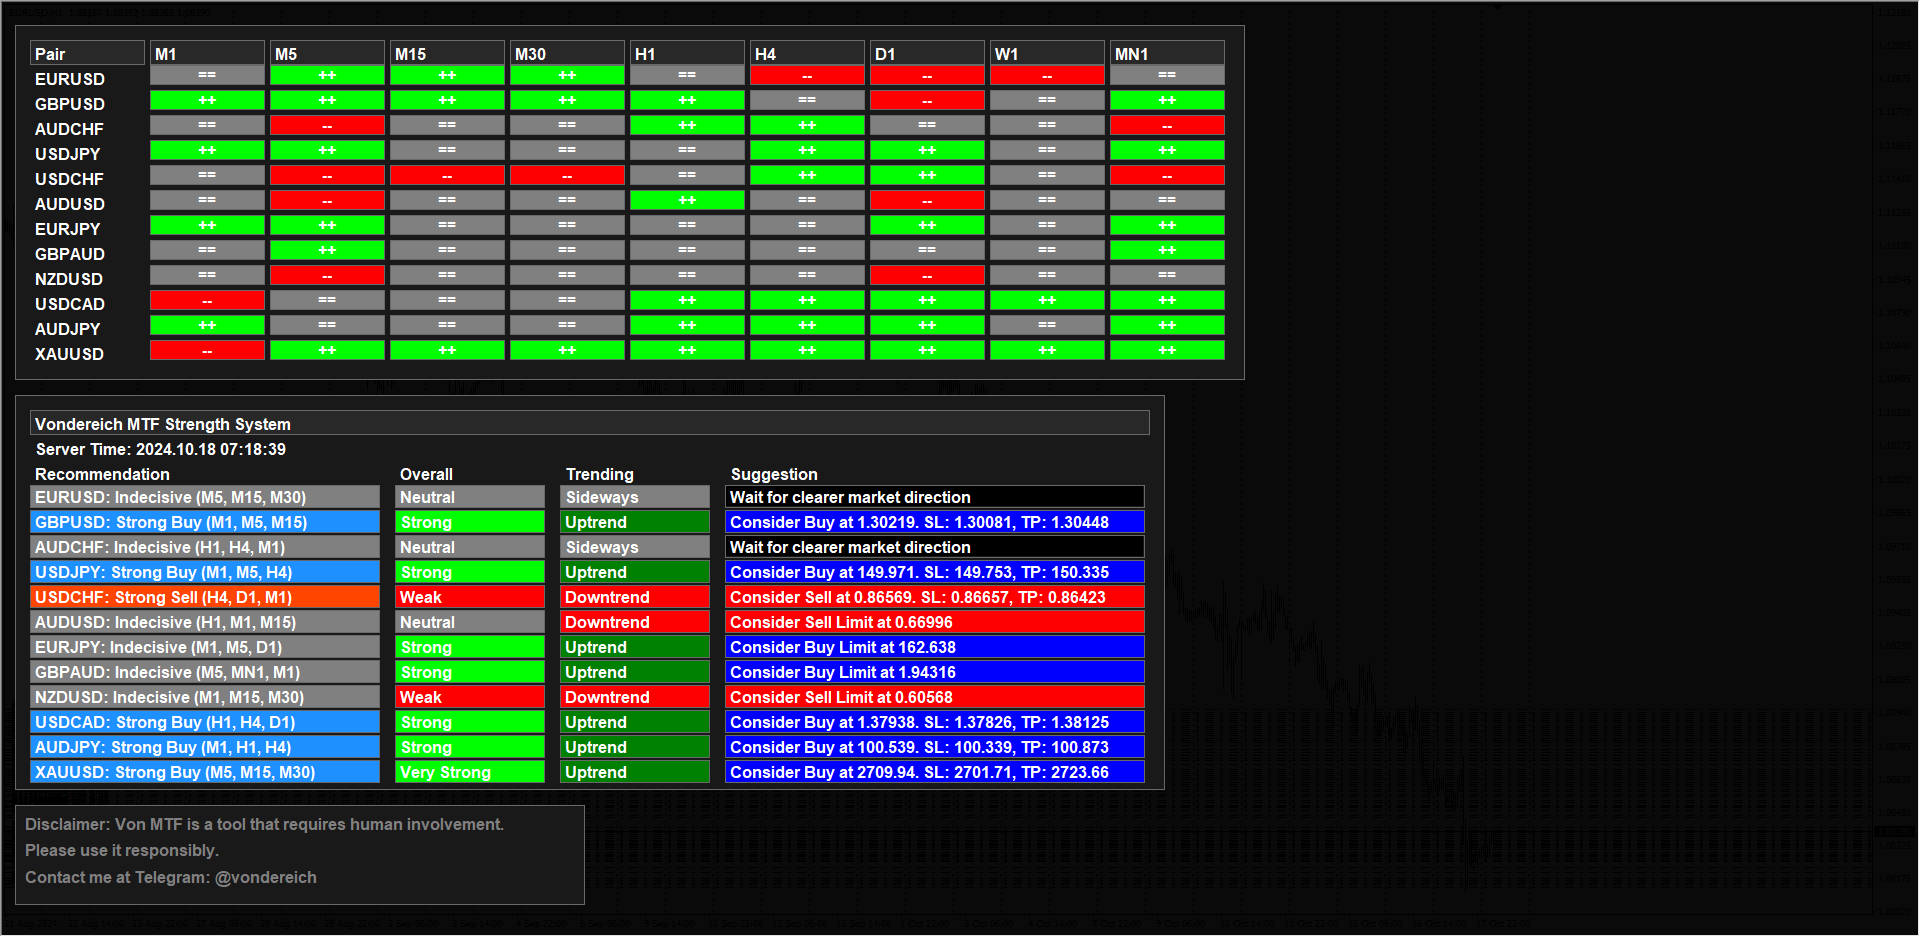
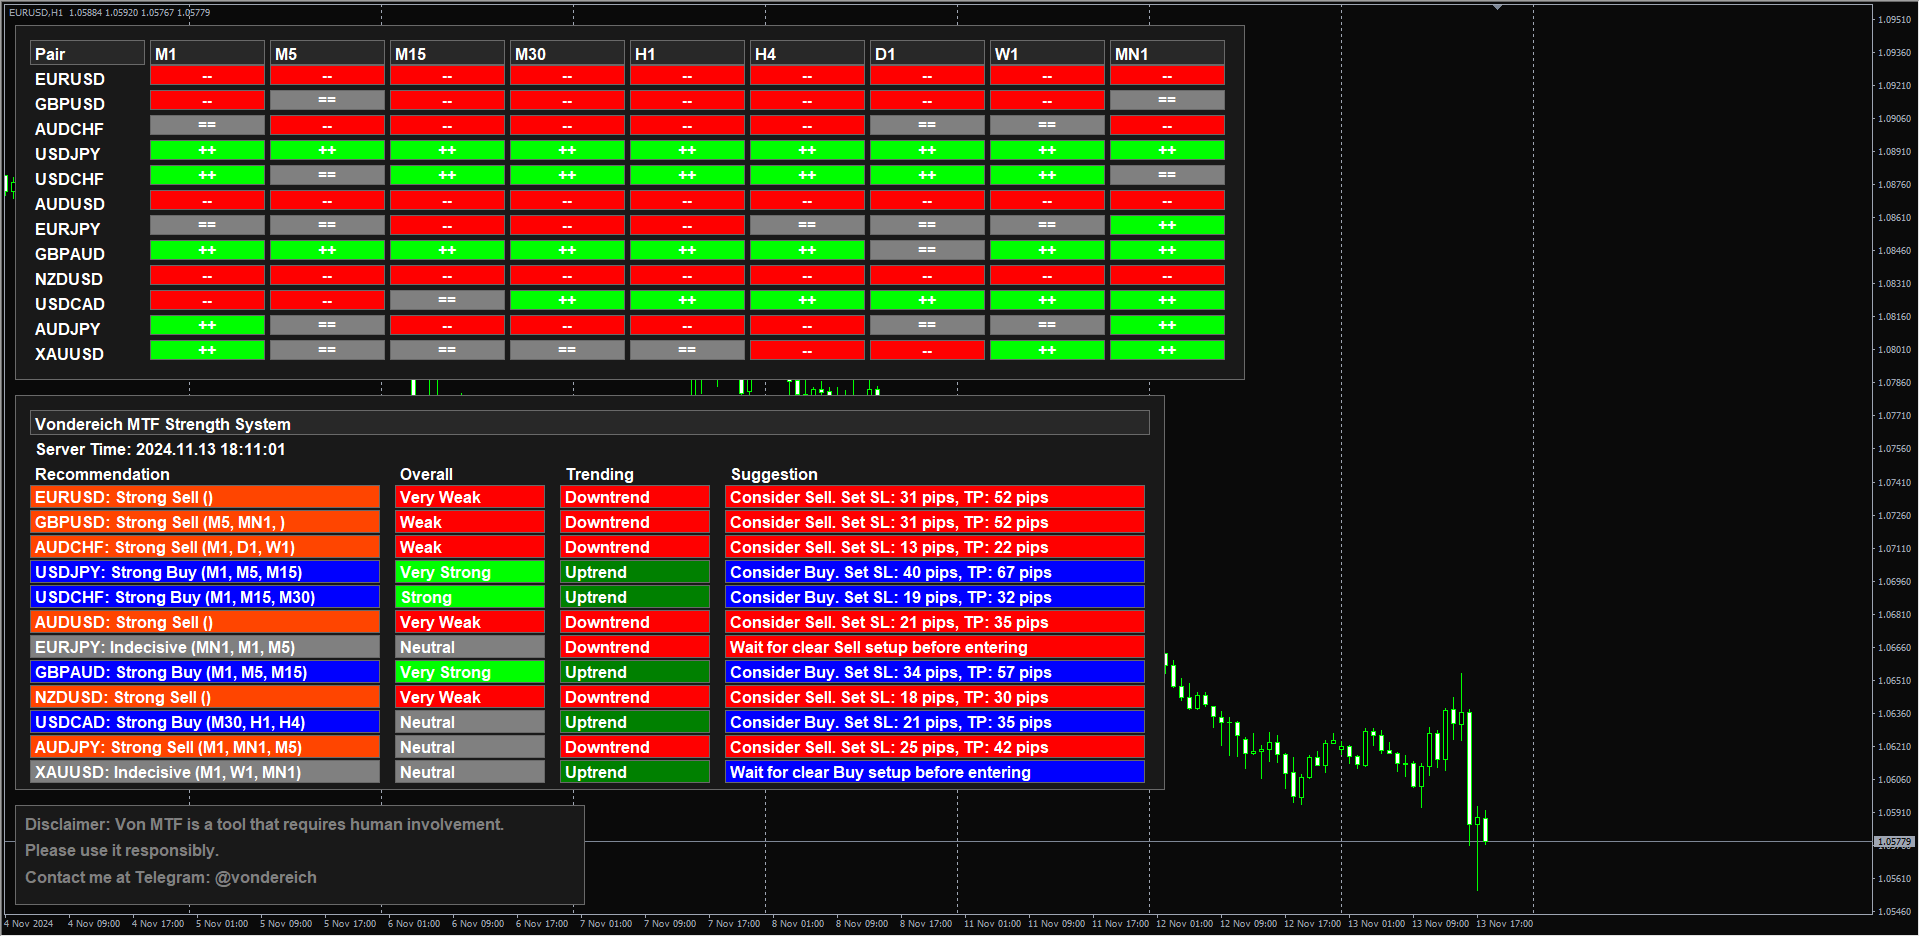
3. Understanding the Indicator Panels:

  • Strength Panel: Shows the strength of a currency pair across multiple timeframes. Each cell indicates whether the trend is strong, weak, or neutral.
  • Recommendation Panel: Provides buy, sell, or hold recommendations for your favorite pairs. This panel shows the overall strength and trending direction, along with actionable suggestions like specific entry, stop-loss, and take-profit levels.
  • Disclaimer Box: Displays important information and contact details.

4. Interpreting Recommendations:

  • Strong Buy/Sell: Indicates a favorable condition for entering a trade in the given direction. Suggested entry prices, stop-loss, and take-profit levels are provided.
  • Neutral/Indecisive: Market conditions are unclear. It's best to wait for a stronger signal before making a trade.
  • Trending (Uptrend/Downtrend): Highlights the prevailing trend direction based on the aggregated signals from different timeframes.

5. Executing Trades:

  • When a Strong Buy or Strong Sell recommendation appears, consider placing a trade with the suggested entry, stop-loss, and take-profit levels.
  • Use the Neutral and Trending indications to adjust your strategy and manage existing trades.

6. Setting Alerts:

  • Enable push notifications in the indicator settings to receive alerts on your mobile device whenever a strong buy or sell signal is generated.
  • This feature helps you stay updated on market movements without constantly monitoring the charts.

7. Using the Indicator for Multiple Pairs:

  • The indicator can monitor multiple currency pairs simultaneously. You can view the strength and recommendations for all your favorite pairs at once on the chart.
  • Select your favorite pairs from the input settings or use the default list provided.

8. Best Practices:

  • Combine the Vondereich MTF Strength Indicator signals with your overall trading strategy and risk management rules.
  • Regularly update the indicator to ensure optimal performance and compatibility with the latest market conditions.
  • Use demo accounts for testing before applying the indicator in live trading to understand its behavior in different market scenarios.

9. Support and Updates:

  • For support and updates, visit the Vondereich FX community at Telegram or contact via the provided social media links.

By following these steps, you can effectively utilize the Vondereich MTF Strength Indicator to enhance your trading decisions and strategies.


Önerilen ürünler
Zig Zag 123
Stephen Reynolds
Zig Zag 123 tells us when a reversal or continuation is more likely by looking at the shift in supply and demand. When this happens a signature pattern appears known as 123 (also known ABC) will often break out in direction of higher low or lower high. Stop loss and take profit levels have been added. There is a panel that shows the overall performance of your trades for if you was to use these stop loss and take profit levels.  We get alerted if a pattern 123 appears and also if the price re
FREE
MT Supply Demand
Issara Seeboonrueang
4 (4)
We provide indicators tailored to better meet your trading requirements.   >>  MT Magical  << MT Supply Demand : It is an indicator created to find supply and demand, which will be important support and resistance levels for the price.  Supply Zone   is a zone where the price has reached, it is often resisted. In other words, when the price reaches this zone, there will be more selling power to push the price back down. Demand Zone   is a zone where the price has reached, it is often ac
FREE
Introduction This indicator detects volume spread patterns for buy and sell opportunity. The patterns include demand and supply patterns. You might use each pattern for trading. However, these patterns are best used to detect the demand zone (=accumulation area) and supply zone (=distribution area). Demand pattern indicates generally potential buying opportunity. Supply pattern indicates generally potential selling opportunity. These are the underlying patterns rather than direct price action. T
FREE
TrendPlus
Sivakumar Subbaiya
4.07 (14)
Trend Plus   Trendplus  Indicator   Time Frame: Suitable for any time frame.  Purpose: Trend Prediction. Blue and red candle indicate the buy and sell call respectively. Buy: When the blue candle is formed buy call is initiated. close the buy trades when the next red candle will formed.   Sell: When the Red candle is formed Sell call is initiated. close the Sell trades when the next blue candle will formed.   Happy trade!!
FREE
Market Profile 3
Hussien Abdeltwab Hussien Ryad
3 (2)
Market Profile 3 MetaTrader 4 indicator  — is a classic Market Profile implementation that can show the price density over time, outlining the most important price levels, value area, and control value of a given trading session. This indicator can be attached to timeframes between M1 and D1 and will show the Market Profile for daily, weekly, monthly, or even intraday sessions. Lower timeframes offer higher precision. Higher timeframes are recommended for better visibility. It is also possible t
FREE
This indicator alerts you when/before new 1 or 5 minute bar candle formed. In other words,this indicator alerts you every 1/5 minutes. This indicator is especially useful for traders who trade when new bars formed. *This indicator don't work propery in strategy tester.Use this in live trading to check functionality. There is more powerful Pro version .In Pro version,you can choose more timeframe and so on. Input Parameters Alert_Or_Sound =Sound ----- Choose alert or sound or both to notify y
FREE
Are you tired of drawing trendlines every time you're analyzing charts? Or perhaps you would like more consistency in your technical analysis. Then this is for you. This indicator will draw trend lines automatically when dropped on a chart. How it works Works similar to standard deviation channel found on mt4 and mt5. It has 2 parameters: 1. Starting Bar 2. Number of bars for calculation The   starting bar   is the bar which drawing of the trend lines will begin, while the   number of bars for c
FREE
Pips forex - is a ready trading system . This indicator shows with arrows on the chart when and in what direction you need to open an order. If the arrow is green, then we open a buy deal, and if the arrow is red, then we open a sell deal. Everything is very simple and quite effective. TakeProfit set 15-25 points. StopLoss set at the level of points. When the dots move, we immediately override the StopLoss. Recommended timeframe for trading M1 and M5. This is a scalping strategy and works best
Rainbow MT4 is a technical indicator based on Moving average with period 34 and very easy to use. When price crosses above MA and MA changes color to green, it’s a signal to buy. When price crosses below MA and MA changes color to red, it’s a signal to sell. The Expert advisor ( Rainbow EA MT4) based on Rainbow MT4 indicator, as you can see in the short video below is now available here .
FREE
The indicator analyzes the change in the minimum and maximum prices of the previous bars fixing the entrance of the big players. If the change (delta) increases, a signal is displayed on the graph in the form of an arrow. At the same time, virtual trade on history is carried out. In the free version, virtual trade is performed without refills in case of a repeat of the signal. The results of virtual trading in the form of losses / losses, profitability, drawdown and transaction lines are display
FREE
Traditional MACD MT4
Daniel Lewis
4.59 (56)
MACD indicator in MetaTrader 4/5 looks different than MACD does in most other charting software. That is because the MetaTrader 4/5 version of MACD displays the MACD line as a histogram when it is traditionally displayed as a line. Additionally, the MetaTrader 4/5 version computes the Signal line using an SMA, while according to MACD definition it is supposed to be an EMA. The MetaTrader 4/5 version also does not compute a true MACD Histogram (the difference between the MACD/Signal lines). This
FREE
Infinity'nin para birimlerinin gücünü ölçen bu yenilikçi gösterge, scalper'lar ve uzun vadeli ticaret yapan tüccarlar için vazgeçilmez bir yardımcıdır. Para birimlerinin Güç / zayıflık analiz sistemi uzun zamandır bilinmektedir ve dünyanın önde gelen tüccarları tarafından piyasada kullanılmaktadır. Herhangi bir arbitraj ticareti bu analiz olmadan tamamlanamaz. Göstergemiz, temel para birimlerinin birbirine göre gücünü kolayca belirler. Tüm para birimlerinde veya mevcut para birimlerinde çizgi g
FREE
High Low Open Close MT4
Alexandre Borela
4.79 (19)
Bu projeyi seviyorsanız, 5 yıldız incelemesi bırakın. Bu gösterge açık, yüksek, düşük ve belirtilen fiyatlar için çizer Dönem ve belirli bir zaman bölgesi için ayarlanabilir. Bunlar birçok kurumsal ve profesyonel tarafından görünen önemli seviyelerdir. tüccarlar ve daha fazla olabileceği yerleri bilmeniz için yararlı olabilir Aktif. Mevcut dönemler şunlardır: Önceki gün. Önceki Hafta. Önceki Ay. Previous Quarter. Önceki yıl. Veya: Mevcut gün. Hafta. Şimdi Ay. Şimdiki Mahallesi. Bugün yıl.
FREE
MASi Three Screens
Aleksey Terentev
5 (2)
MASi Three Screens is based on the trading strategy by Dr. Alexander Elder. This indicator is a collection of algorithms. Algorithms are based on the analysis of charts of several timeframes. You can apply any of the provided algorithms. List of versions of algorithms:     ThreeScreens v1.0 - A simple implementation, with analysis of the MACD line;     ThreeScreens v1.1 - A simple implementation, with analysis of the MACD histogram;     ThreeScreens v1.2 - Combines the first two algorithms in
FREE
The indicator allows you to trade binary options. The recommended time frame is М1 and the expiration time is 1,2,3 minutes. The indicator suitable for auto and manual trading. A possible signal is specified as a arrows above/under a candle. You should wait until the candle closes! Arrows are not re-painted Trade sessions: TOKYO section (Half-end) Currency pairs: USD/JPY Working time frame: M1 Expiration time: 1,2,3 minutes. The indicator also shows good results when using the martingale strateg
FREE
Lisek Weis Wave
Darius Hans Lischka
5 (3)
This Weis Wave Volume indicator is a tool to help traders identify the current price trend.  Understanding volume can provide insight into a market's behavior to help you determine its overall health. The most important rule is this: volume precedes price. Typically, before a market price moves, volume comes into play. It has 2 main colors histogram which are green and red. – Green indicates an upward wave. The more the price increases, the bigger the green volume gets. – The red color shows a d
FREE
Head and Shoulders Pattern Indicator - Your Key to Recognizing Trend Reversals Unlock the power of pattern recognition with the "Head and Shoulders Pattern Indicator." This cutting-edge tool, designed for MetaTrader, is your trusted ally in identifying one of the most powerful chart patterns in technical analysis. Whether you're a novice or an experienced trader, this indicator simplifies the process of spotting the Head and Shoulders pattern, allowing you to make informed trading decisions. Key
FREE
OrderBlock TS Roman
Vladislav Vlastovskii
3.8 (5)
Индикатор строит блоки заказов (БЗ) по торговой системе (ТС) Романа. Поиск блоков осуществляется одновременно на двух таймфремах: текущем и старшем (определяемым в настройках). Для оптимизации и игнорирования устаревших блоков в настройках задается ограничение количества дней в пределах которых осуществляется поиск блоков. Блоки строятся по правилам ТС состоящем из трех шагов: какую свечу вынесли (что?); какой свечой вынесли (чем?); правило отрисовки (как?).
FREE
FVGs MT4
Andrii Hurin
5 (5)
A simple indicator that automatically highlights all FVGs (Fair Value Gaps) formed on the chart, as well as FVGs on history. It is possible to select colors for FVGs of different directions (long or short), select the time interval, select the color of middle point and you can also choose whether to delete filled FVGs or leave them on the chart (the option is beneficial for backtesting). The indicator can be very useful for those, who trade according to the concept of smart money, ICT, or simply
FREE
Deep Insight Candles is an indicator that brings an entirely new perspective to the price chart. It focuses on revealing hidden structures in market movements, uncovering buyer and seller pressure, thus helping traders to better identify key levels, dynamics, and potential reversals. The indicator conveys deeper market insights, allowing traders to make decisions based on a more accurate perception of market sentiment and pressure at specific price levels. This innovative approach transforms the
BoxInside MT4
Evgeny Shevtsov
4.86 (7)
This indicator calculates the volume profile and places labels that correspond to the VAH, VAL and POC levels, for each candle individually. Indicator operation features The indicator works on the timeframes from M5 to MN, but it uses the history data of smaller periods: M1 - for periods from M5 to H1, M5 - for the H4 period, M30 - for the D1 period, H4 - for the W1 period, D1 - for the MN period. The color and location of the VAL, VAH and POC labels on the current candle are considered to be c
FREE
Highlights trading sessions on the chart The demo version only works on the AUDNZD chart!!! The full version of the product is available at: (*** to be added ***) Trading Session Indicator displays the starts and ends of four trading sessions: Pacific, Asian, European and American. the ability to customize the start/end of sessions; the ability to display only selected sessions; works on M1-H2 timeframes; The following parameters can be configured in the indicator: TIME_CORRECTION = Correct
FREE
Wicks UpDown Target GJ Wicks UpDown Target GJ is specialized in GJ forex pairs. Choppy movement up and down on the opening range every day.  Trading breakouts on London session and New York session is recommended. Guideline Entry Strategy Idea: Step 1 - Breakout Forming (Warning! Trade on London Session and New York Session) Step 2 - Breakout Starting (Take Action on your trading plan) Step 3 - Partial Close your order & set breakeven (no-risk) Step 4 - Target complete Step 5 - Don't trade
FREE
MegaTrends
Sivakumar Subbaiya
1 (1)
Megatrends  Indicator   Time Frame: Suitable for any time frame.  Purpose: Trend Prediction. Blue and red color indicate the buy and sell call respectively. Buy: When the blue line is originating it is opened buy call. Sell: When the Red line is origination it is opened sell call Happy trade!! this indicator is suitable for all time frame, but our recommended time frame to use 1hour and 4 hours, suitable for any chart.
FREE
Cumulative Delta MT4
Evgeny Shevtsov
4.86 (29)
The indicator analyzes the volume scale and splits it into two components - seller volumes and buyer volumes, and also calculates the delta and cumulative delta. The indicator does not flicker or redraw, its calculation and plotting are performed fairly quickly, while using the data from the smaller (relative to the current) periods. The indicator operation modes can be switched using the Mode input variable: Buy - display only the buyer volumes. Sell - display only the seller volumes. BuySell -
FREE
Discover the power of precision and efficiency in your trading with the " Super Auto Fibonacci " MT4 indicator. This cutting-edge tool is meticulously designed to enhance your technical analysis, providing you with invaluable insights to make informed trading decisions. Key Features: Automated Fibonacci Analysis: Say goodbye to the hassle of manual Fibonacci retracement and extension drawing. "Super Auto Fibonacci" instantly identifies and plots Fibonacci levels on your MT4 chart, saving you tim
FREE
Extremum Reverse Bar
Yurij Izyumov
2.8 (5)
This indicator has been created for finding the probable reversal points of the symbol price. A small candlestick reversal pattern is used it its operation in conjunction with a filter of extremums. The indicator is not redrawn! If the extremum filter is disabled, the indicator shows all points that have a pattern. If the extremum filter is enabled, the condition works – if the history Previous bars 1 candles back contains higher candles and they are farther than the Previous bars 2 candle, such
FREE
Dollar mint indicator is a special workmanship with years of experience in forex.   Dollar mint ea is a fully non repaint indicator optimised with price action data such that once it gives you a signal t . The indicator   can be used to trade anything on the mt4 with much ease. Benefits ; Fully non repaint Use in any timeframe Use in all the available tradable assets on mt4 Best to use on h4. It generates fully analysed buy and sell signals based on trend and also filters out retracements and
Introducing the Consecutive Green/Red Candle Alert Indicator for MT4 - Your Trend Spotting Companion! Are you ready to take your trading to the next level? We present the Consecutive Green/Red Candle Alert Indicator, a powerful tool designed to help you spot trends and potential reversals with ease. Whether you're a new trader looking for clarity in the market or an experienced pro seeking additional confirmation, this indicator is your trusted companion. Key Features of the Consecutive Green/Re
FREE
A simple but very useful indicator that allows you to display the current date and time on the chart. Especially useful when you save your analysis or trades. Features: show local date and time show server date and time show remaining time to end the current timeframe interval customizable display parameters - show/hide date or time set display position set display size set display color works on every timeframe
Bu ürünün alıcıları ayrıca şunları da satın alıyor
Gann Made Easy
Oleg Rodin
4.79 (110)
Gann Made Easy , bay teorisini kullanarak ticaretin en iyi ilkelerine dayanan, profesyonel ve kullanımı kolay bir Forex ticaret sistemidir. WD Gann. Gösterge, Zararı Durdur ve Kâr Al Seviyeleri dahil olmak üzere doğru SATIN AL ve SAT sinyalleri sağlar. PUSH bildirimlerini kullanarak hareket halindeyken bile işlem yapabilirsiniz. Lütfen satın aldıktan sonra benimle iletişime geçin! Alım satım ipuçlarımı ve harika bonus göstergelerini ücretsiz olarak sizinle paylaşacağım! Muhtemelen Gann ticaret y
Dynamic Forex28 Navigator
Bernhard Schweigert
5 (4)
Dynamic Forex28 Navigator - Yeni Nesil Forex Ticaret Aracı. ŞU ANDA %49 İNDİRİM. Dynamic Forex28 Navigator, uzun zamandır popüler olan göstergelerimizin evrimidir ve üçünün gücünü tek bir göstergede birleştirir: Gelişmiş Döviz Gücü28 Göstergesi (695 inceleme) + Gelişmiş Döviz İMPULS ve UYARI (520 inceleme) + CS28 Kombo Sinyalleri (Bonus). Gösterge hakkında ayrıntılar https://www.mql5.com/en/blogs/post/758844 Yeni Nesil Güç Göstergesi Ne Sunuyor?  Orijinallerde sevdiğiniz her şey, şimdi yeni
Gold Venamax MT4
Sergei Linskii
5 (1)
Gold Venamax   - bu en iyi hisse senedi teknik göstergesidir. Gösterge algoritması bir varlığın fiyat hareketini analiz eder ve oynaklığı ve potansiyel giriş bölgelerini yansıtır. Gösterge özellikleri: Bu, rahat ve karlı ticaret için Magic ve iki Blok trend oku içeren süper bir göstergedir. Grafikte blokları değiştirmek için Kırmızı Düğme görüntülenir. Magic, gösterge ayarlarında ayarlanır, böylece göstergeyi farklı Blokları görüntüleyen iki grafiğe yükleyebilirsiniz. Gold Venamax farklı ok t
-   Real price is 80$   - 40% Discount ( It is 49$ now ) - Lifetime update free Contact me for instruction, add group and any questions! Related Products:  Bitcoin Expert , Gold Expert - Non-repaint - I just sell my products in Elif Kaya profile, any other websites are stolen old versions, So no any new updates or support. Introduction The breakout and retest strategy is traded support and resistance levels. it involves price breaking through a previous level.  The break and retest strategy is
Scalper Inside PRO
Alexey Minkov
4.76 (62)
!SPECIAL SALE! An exclusive indicator that utilizes an innovative algorithm to swiftly and accurately determine the market trend. The indicator automatically calculates opening, closing, and profit levels, providing detailed trading statistics. With these features, you can choose the most appropriate trading instrument for the current market conditions. Additionally, you can easily integrate your own arrow indicators into Scalper Inside Pro to quickly evaluate their statistics and profitability
IX Power MT4
Daniel Stein
4.67 (6)
IX Power: Endeksler, Emtialar, Kripto Paralar ve Forex Piyasaları için İçgörüler Genel Bakış IX Power , endeksler, emtialar, kripto paralar ve forex sembollerinin gücünü analiz etmek için tasarlanmış çok yönlü bir araçtır. FX Power , tüm kullanılabilir döviz çiftlerinin verilerini kullanarak döviz çiftleri için maksimum doğruluk sağlarken, IX Power yalnızca temel sembolün piyasa verilerine odaklanır. Bu, IX Power 'ı forex dışındaki piyasalar için ideal ve daha basit forex analizleri için güven
Enigmera
Ivan Stefanov
5 (6)
ENIGMERA: Pazarın Kalbi Önemli: MQL5.com demosu Strategy Tester'da çalışır ve Enigmera'nın tüm işlevlerini tam olarak yansıtmayabilir. Daha fazla bilgi için açıklamayı, ekran görüntülerini ve videoyu kontrol edin. Herhangi bir sorunuz varsa, bana mesaj göndermekten çekinmeyin! Göstergenin kodu tamamen yeniden yazılmıştır. 3.0 sürümü, yeni işlevler ekler ve göstergenin başlangıcından bu yana biriken hataları giderir. Giriş Bu gösterge ve ticaret sistemi, finansal piyasalara dikkat çekici bir ya
FX Power MT4 NG
Daniel Stein
4.94 (18)
FX Power: Daha Akıllı Ticaret Kararları için Para Birimlerinin Gücünü Analiz Edin Genel Bakış FX Power , her piyasa koşulunda başlıca para birimlerinin ve altının gerçek gücünü anlamak için vazgeçilmez bir araçtır. Güçlü para birimlerini alıp zayıf olanları satarak, FX Power ticaret kararlarınızı basitleştirir ve yüksek olasılıklı fırsatları ortaya çıkarır. İster trendlere sadık kalın ister Delta'nın aşırı değerlerini kullanarak tersine dönüşleri öngörün, bu araç ticaret tarzınıza mükemmel bir
FX Levels MT4
Daniel Stein
5 (2)
FX Levels: Tüm Piyasalar İçin Son Derece Hassas Destek ve Direnç Hızlı Bakış Döviz kurları, endeksler, hisseler veya emtialar gibi herhangi bir piyasada güvenilir destek ve direnç seviyeleri belirlemek mi istiyorsunuz? FX Levels geleneksel “Lighthouse” yöntemini ileri düzey bir dinamik yaklaşımla birleştirerek neredeyse evrensel bir doğruluk sağlar. Gerçek broker deneyimimize ve otomatik günlük güncellemeler ile gerçek zamanlı güncellemelerin birleşimine dayalı olarak, FX Levels size dönüş nok
Golden Trend Indicator
Noha Mohamed Fathy Younes Badr
4.9 (10)
Golden Trend indicator  is The best indicator for predicting trend movement this indicator never lags and never repaints and never back paints    and give  arrow buy and sell    before the candle appear  and it will help you and  will make your trading decisions clearer its work on all currencies and  gold and crypto and all time frame This unique  indicator uses very secret algorithms to catch the  trends, so you can trade using this indicator and see the trend clear on charts  manual guide and
Easy Breakout
Mohamed Hassan
5 (9)
After your purchase, feel free to contact me for more details on how to receive a bonus indicator called VFI, which pairs perfectly with Easy Breakout for enhanced confluence!   Easy Breakout is a powerful price action trading system built on one of the most popular and widely trusted strategies among traders: the Breakout strategy ! This indicator delivers crystal-clear Buy and Sell signals based on breakouts from key support and resistance zones. Unlike typical breakout indicators, it levera
Scalper Vault
Oleg Rodin
5 (28)
Scalper Vault , başarılı bir scalping için ihtiyacınız olan her şeyi size sağlayan profesyonel bir scalping sistemidir. Bu gösterge, forex ve ikili opsiyon tüccarları tarafından kullanılabilecek eksiksiz bir ticaret sistemidir. Önerilen zaman çerçevesi M5'tir. Sistem size trend yönünde doğru ok sinyalleri sağlar. Ayrıca size üst ve alt sinyaller ve Gann piyasa seviyeleri sağlar. Göstergeler, PUSH bildirimleri dahil her türlü uyarıyı sağlar. Göstergeyi satın aldıktan sonra lütfen benimle iletişim
FX Volume
Daniel Stein
4.59 (34)
FX Volume: Bir Broker’ın Perspektifinden Gerçek Piyasa Duyarlılığını Deneyimleyin Kısa Özet Trading yaklaşımınızı bir adım öteye taşımak ister misiniz? FX Volume , perakende traderlar ile brokerların nasıl konumlandığını gerçek zamanlı olarak sunar—COT gibi gecikmeli raporlardan çok daha önce. İster istikrarlı kazançları hedefliyor olun, ister piyasada daha güçlü bir avantaj arayın, FX Volume önemli dengesizlikleri belirlemenize, kırılmaları (breakout) doğrulamanıza ve risk yönetiminizi iyileş
Advanced Supply Demand
Bernhard Schweigert
4.91 (294)
CURRENTLY 26% OFF !! Best Solution for any Newbie or Expert Trader! This indicator is a unique, high quality and affordable trading tool because we have incorporated a number of proprietary features and a new formula. With this update, you will be able to show double timeframe zones. You will not only be able to show a higher TF but to show both, the chart TF, PLUS the higher TF: SHOWING NESTED ZONES. All Supply Demand traders will love it. :) Important Information Revealed Maximize the potentia
Şu anda %20 İNDİRİMLİ! Herhangi bir Acemi veya Uzman Tüccar için En İyi Çözüm! Bu gösterge paneli yazılımı 28 döviz çifti üzerinde çalışıyor. Ana göstergelerimizden 2'sine (Gelişmiş Para Birimi Gücü 28 ve Gelişmiş Para Birimi Dürtüsü) dayanmaktadır. Tüm Forex piyasasına harika bir genel bakış sağlar. Gelişmiş Para Birimi Gücü değerlerini, para birimi hareket hızını ve tüm (9) zaman dilimlerinde 28 Forex çifti için sinyalleri gösterir. Trendleri ve / veya scalping fırsatlarını belirlemek için
Special offer : ALL TOOLS , just $35 each! New tools   will be   $30   for the   first week   or the   first 3 purchases !  Trading Tools Channel on MQL5 : Join my MQL5 channel to update the latest news from me MT5 için devrim niteliğindeki RSI Kernel Optimized with Scanner’ı sunuyoruz. Bu gelişmiş araç, güçlü Çekirdek Yoğunluk Tahmin (KDE) algoritmasını entegre ederek geleneksel RSI analizini yeniden tanımlıyor. Bu gelişmiş gösterge, sadece piyasadaki trendlerle ilgili gerçek zamanlı bilgiler
Supply and Demand Dashboard PRO
Bernhard Schweigert
4.8 (20)
Şu anda %20 İNDİRİMLİ! Bu gösterge paneli, birden fazla sembol ve 9 zaman dilimine kadar çalışan çok güçlü bir yazılım parçasıdır. Ana göstergemize dayanmaktadır (En iyi yorumlar: Advanced Supply Demand ).     Gösterge paneli harika bir genel bakış sağlar. Gösterir:    Bölge mukavemet derecesi dahil filtrelenmiş Arz ve Talep değerleri, Bölgelere/ve bölgeler içindeki pip mesafeleri, İç içe geçmiş bölgeleri vurgular, Tüm (9) zaman dilimlerinde seçilen semboller için 4 çeşit uyarı verir. Kişisel
GOLD Impulse with Alert
Bernhard Schweigert
4.6 (10)
Bu gösterge, 2 ürünümüz Advanced Currency IMPULSE with ALERT  +   Currency Strength Exotics  'in süper bir kombinasyonudur. Tüm zaman dilimleri için çalışır ve 8 ana para birimi artı bir Sembol için grafiksel olarak güç veya zayıflık dürtüsünü gösterir! Bu Gösterge, Altın, Egzotik Çiftler, Emtialar, Endeksler veya Vadeli İşlemler gibi herhangi bir sembol için para birimi gücü ivmesini göstermek için uzmanlaşmıştır. Türünün ilk örneğidir, Altın, Gümüş, Petrol, DAX, US30, MXN, TRY, CNH vb. içi
FX Dynamic: Özelleştirilebilir ATR Analiziyle Volatilite ve Trendleri Takip Edin Genel Bakış FX Dynamic , ortalama gerçek aralık (ATR) hesaplamalarını kullanarak günlük ve gün içi volatilite hakkında rakipsiz bilgiler sağlayan güçlü bir araçtır. 80%, 100%, 130% gibi net volatilite eşikleri ayarlayarak, piyasa olağan hareketlerinin ötesine geçtiğinde hızlı şekilde uyarı alabilir ve potansiyel kazanç fırsatlarını süratle tespit edebilirsiniz. FX Dynamic , brokerınızın zaman dilimine uyum sağlaya
System Trend Pro
Aleksandr Makarov
5 (2)
System Trend Pro - This is the best trend trading indicator!!! You can get this indicator for free -  Quantum Entry PRO The indicator no repaint!!!  The indicator has   MTF   mode, which adds confidence to trading on the trend (   no repaint   ). How to trade? Everything is very simple, we wait for the first signal (big arrow), then wait for the second signal (small arrow) and enter the market in the direction of the arrow. (See screens 1 and 2.) Exit on the opposite signal or take 20-30 pips
Meravith
Ivan Stefanov
Gösterge, her noktadan hacmi analiz eder ve bu hacim için piyasa tükenme seviyelerini hesaplar. Üç çizgiden oluşur: Boğa hacmi tükenme çizgisi Ayı hacmi tükenme çizgisi Piyasa trendini gösteren bir çizgi. Bu çizgi, piyasanın boğa mı yoksa ayı mı olduğunu yansıtacak şekilde rengini değiştirir. Piyasayı istediğiniz herhangi bir başlangıç noktasından analiz edebilirsiniz. Bir hacim tükenme çizgisine ulaşıldığında, bir sonraki analize başlamak için yeni bir nokta belirleyin. Herhangi bir şeyi analiz
Trend Screener
STE S.S.COMPANY
4.78 (93)
Trend Göstergesi, Trend Alım Satım ve Filtreleme için Çığır Açan Benzersiz Çözüm, Tüm Önemli Trend Özellikleriyle Tek Bir Araç İçinde Yerleştirildi! Forex, emtialar, kripto para birimleri, endeksler ve hisse senetleri gibi tüm sembollerde/araçlarda kullanılabilen %100 yeniden boyamayan çoklu zaman çerçevesi ve Çoklu para birimi göstergesidir. SINIRLI SÜRELİ TEKLİF: Destek ve Direnç Tarama Göstergesi sadece 50$ ve ömür boyu mevcuttur. (Orijinal fiyat 250$) (teklif uzatıldı) Trend Screener, grafik
Currency Strength Exotics
Bernhard Schweigert
4.87 (31)
ŞU ANDA %20 INDIRIMLI! Herhangi bir Acemi veya Uzman Tüccar için En İyi Çözüm! Bu Gösterge, Egzotik Çiftler Emtialar, Endeksler veya Vadeli İşlemler gibi herhangi bir sembol için para birimi gücünü göstermek için uzmanlaşmıştır. Türünün ilk örneğidir, Altın, Gümüş, Petrol, DAX, US30, MXN, TRY, CNH vb. gerçek para birimi gücünü göstermek için 9. satıra herhangi bir sembol eklenebilir. Bu benzersiz, yüksek kaliteli ve uygun fiyatlı bir ticaret aracıdır çünkü bir dizi tescilli özelliği ve yeni b
"Chart Patterns All in One" ürününü demo modunda deneyin ve bonus kazanın. Demo modunda denedikten sonra bana mesaj göndererek bonusunuzu alın. Satın aldıktan sonra yorum bırakın, bonus olarak 8 yüksek kaliteli gösterge alın. Chart Patterns All-in-One göstergesi, traderların teknik analizde yaygın olarak kullanılan çeşitli grafik desenlerini görselleştirmelerine yardımcı olur. Bu gösterge, potansiyel piyasa hareketlerini belirlemeye yardımcı olur ancak kârlılığı garanti etmez. Satın almadan önc
Bu gösterge paneli, seçilen semboller için mevcut en son harmonik kalıpları gösterir, böylece zamandan tasarruf edersiniz ve daha verimli olursunuz / MT5 sürümü . Ücretsiz Gösterge: Basic Harmonic Pattern Gösterge sütunları Symbol : seçilen semboller görünecektir Trend: yükseliş veya düşüş Pattern : desen türü (gartley, kelebek, yarasa, yengeç, köpekbalığı, cypher veya ABCD) Entry : giriş fiyatı SL: zararı durdur fiyatı TP1: 1. kar alma fiyatı TP2: 2. kar alma fiyatı TP3: 3. kar alma fiyatı
Bonus: when you buy or rent the indicator, you get Gold Pro Scalper   or System Trend Pro absolutely free.(unlimited) After purchase, contact me to learn more about how to get the bonus indicator that pairs perfectly with Quantum Entry for improved merging! Quantum Entry is a powerful price action trading system built on one of the most popular and widely known strategies among traders: the Breakout Strategy! This indicator produces crystal clear buy and sell signals based on breakouts of key
TPSpro RFI Levels
Roman Podpora
4.85 (26)
TALİMATLAR         RUS   -        ENG       Bir gösterge ile kullanılması   önerilir       -       TPSpro   TREND PRO -   Sürüm MT4         Ticarette önemli bir unsur, bir ticaret aracını satın alma veya satma kararlarının alındığı bölgeler veya seviyelerdir. Büyük oyuncuların piyasadaki varlıklarını gizleme girişimlerine rağmen, kaçınılmaz olarak izler bırakırlar. Bizim görevimiz bu izleri nasıl tanımlayacağımızı ve doğru şekilde nasıl yorumlayacağımızı öğrenmekti. Ana işlevler:: Satıcılar ve
Bull versus Bear
Mohamed Hassan
4.5 (18)
Send us a message after your purchase to receive more information on how to get your  BONUS  for FREE  that works in great combination with Bull vs Bear ! Bull versus Bear is an easy-to-use Forex indicator that gives traders clear and accurate signals based on clear trend retests . Forget about lagging indicators or staring at charts for hours because  Bull vs Bear provides real-time entries with no lag and no repaint, so you can trade with confidence. Bull vs Bear  helps you enter trades durin
Special offer : ALL TOOLS , just $35 each! New tools   will be   $30   for the   first week   or the   first 3 purchases !  Trading Tools Channel on MQL5 : Join my MQL5 channel to update the latest news from me ICT’nin Inversion Fair Value Gap (IFVG) konseptinin gücünü Inversion Fair Value Gaps Indicator ile keşfedin! Bu son teknoloji araç, Fair Value Gaps (FVG) analizini bir adım öteye taşıyarak ters çevrilmiş FVG bölgelerini tanımlar ve gösterir — fiyat düzeltmesinden sonra oluşan önemli dest
PZ Harmonacci Patterns
PZ TRADING SLU
3.17 (6)
Trade smarter, not harder: Empower your trading with Harmonacci Patterns Special Offer: Purchase now to receive free bonuses worth $165! (Read more for details) This is arguably the most complete harmonic price formation auto-recognition indicator you can find for the MetaTrader Platform. It detects 19 different patterns, takes fibonacci projections as seriously as you do, displays the Potential Reversal Zone (PRZ) and finds suitable stop-loss and take-profit levels. [ Installation Guide | Upda
Yazarın diğer ürünleri
VondereichFX EA
Mohd Hakim Johari
4.14 (7)
"Upgrade to the Next Level of Trading with the Vondereich v1.3 Expert Advisor" "Take your trading to the next level with the upgraded version of the Vondereich v1.3 Expert Advisor. This cutting-edge EA features a wealth of advanced features, including: Auto compounding by percentage Customizable trading time frame RSI indicator integration Semi-hedging (Auto) system and more This EA uses a martingale strategy with a customizable pipstep to ensure the safety of your margin. By adjusting the pips
FREE
Zielspierre EA Overview: Zielspierre EA, developed by Vondereich FX, is a sophisticated, fully automated trading expert advisor (EA) designed to optimize trading performance on cent/micro accounts. Tailored for serious traders, this EA ensures a consistent monthly return on investment (ROI) with minimal risk, making it ideal for both novice and experienced traders. Key Features: Group Layering System: Employs a layered group of martingale strategy for optimal trade management, ensuring lower ri
Filtrele:
İnceleme yok
İncelemeye yanıt
Sürüm 3.8 2025.01.17
Fix bug no indi were shown on the chart..
Sürüm 3.7 2025.01.17
"Minor upgrade to improve filter accuracy and enhance overall performance."

This version is concise and professional.
Sürüm 3.6 2024.11.18
Version 3.6

Introduction to the BBMA version.. Which is giving more accurate data..

Cleaning more code line..
Sürüm 3.5 2024.11.13
Improved suggestion reading..

Instead showing suggested entry using price which is moving every second..

Now using auto generate TP and SL from the system.. It suggest how many tp and sl should be use
Sürüm 3.1 2024.10.18
Vondereich MTF Indicator v3.0 Release Notes

We are thrilled to introduce Vondereich MTF Indicator version 3.0, packed with upgrades that deliver enhanced precision and a visually improved user experience.

New Features and Enhancements:

Advanced Graphical Overhaul: Enjoy a cleaner, more intuitive display with improved chart elements and visual guidance, making it easier to interpret market conditions and trends at a glance.

Increased Sensitivity to Market Data: Our updated algorithm now reacts more precisely to price movements, providing earlier signals for potential opportunities and sharper trend detection across all timeframes.

Improved Performance and Speed: Benefit from further code refinements to ensure faster execution and reduced lag, even with multiple pairs and timeframes running simultaneously.

Enhanced Customization: Tailor your experience with advanced settings for timeframe and pair selection, giving you complete control over your strategy and trading environment.

Upgrade to version 3.0 today and experience the next level of trading insights and performance with the Vondereich MTF Indicator!
Sürüm 2.5 2024.09.26
Vondereich MTF Indicator v2.5 Release Notes

We are excited to announce the release of Vondereich MTF Indicator version 2.5, featuring significant enhancements for a smoother user experience.

New Features:

1. Code Optimization: Experience a more streamlined and efficient codebase for improved performance and faster execution.

2. Dynamic Pair Management: Easily add or remove trading pairs as needed, giving you the flexibility to customize your trading strategy.

3. Custom Timeframe Selection: Choose your desired timeframe with ease, allowing for greater adaptability and precision in your analysis.

4. Upcoming Graphical Enhancements: Stay tuned for our soon-to-be-released graphical features, designed to enhance your visualization and analysis experience.

Upgrade to version 2.5 today and take advantage of these powerful new features!