Indicator PTB
- Göstergeler
- Phan Thanh Binh
- Sürüm: 1.0
Description:
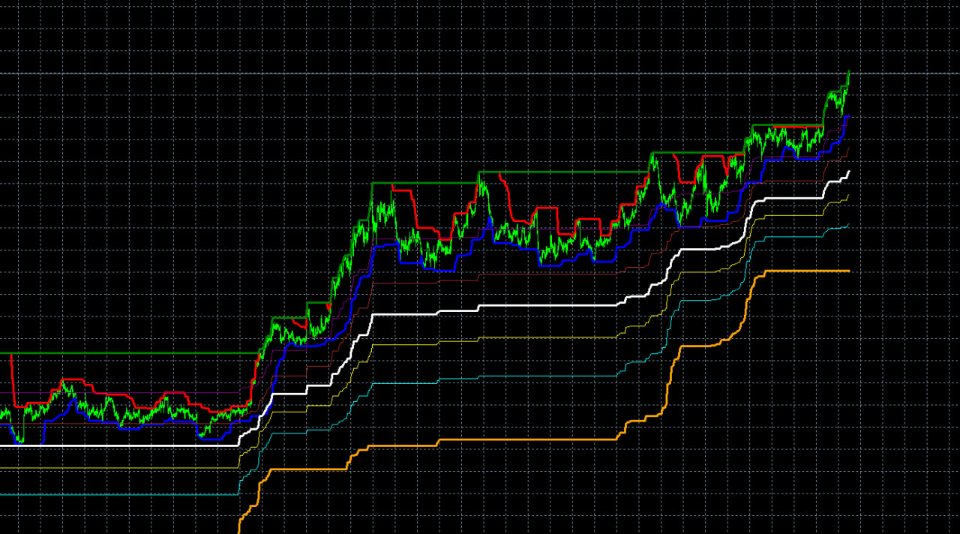
The PTB_MoneyFlow indicator is designed to help traders identify key price levels and potential price movements using Fibonacci retracement levels, alongside tracking recent highs and lows over both short and long periods.
Key Features:
Highs and Lows Tracking:
The indicator calculates and plots the highest and lowest prices over two user-defined lookback periods:
Short Lookback Period: Default is 3 bars.
Long Lookback Period: Default is 144 bars.
These levels are plotted on the chart, helping to highlight recent market extremes.
Fibonacci Retracement Levels:
The indicator calculates and plots the Fibonacci retracement levels based on the long lookback period's high and low prices.
The following Fibonacci levels are included: 0.236, 0.382, 0.5, 0.618, and 0.786.
Each Fibonacci level is represented with different colors for quick visual identification. The lines are drawn with 50% transparency to ensure clarity when multiple lines overlap.
Price Cross Alerts:
The indicator monitors if the current price crosses any of the key Fibonacci levels and triggers alerts when a crossover occurs. This can provide valuable signals for potential reversal or continuation of price movements at these critical levels.
Visuals:
Both the short and long period highs and lows are plotted with distinct colors.
Fibonacci lines are drawn in dotted styles with custom colors and transparency, making the chart easier to interpret.
Usage:
This indicator is useful for traders looking to:
Identify areas of price support and resistance using Fibonacci levels.
Track recent market extremes over different timeframes.
Set alerts for when price crosses important Fibonacci retracement levels, which could indicate potential trading opportunities.
The indicator is versatile and can be adapted to various trading strategies that rely on Fibonacci analysis and tracking key market highs and lows.


