RSI Dual Timeframe
- Göstergeler
- Asanka Manikgama Arachchilage Don
- Sürüm: 1.1
- Güncellendi: 23 Eylül 2024
Dual Time Frame RSI with Custom Alerts & Visuals
Dual Time Frame RSI is an advanced RSI (Relative Strength Index) indicator designed for traders who want to monitor multiple timeframes simultaneously and customize alerts and visuals for better trading decisions. This tool allows you to combine two RSI readings from different timeframes, helping you identify stronger trends and overbought/oversold conditions across multiple time horizons.
Key Features:
-
Two Timeframes:
- The lower timeframe is always the current chart’s timeframe.
- The higher timeframe is user-selectable, allowing any timeframe higher than the current one.
-
Customizable Display:
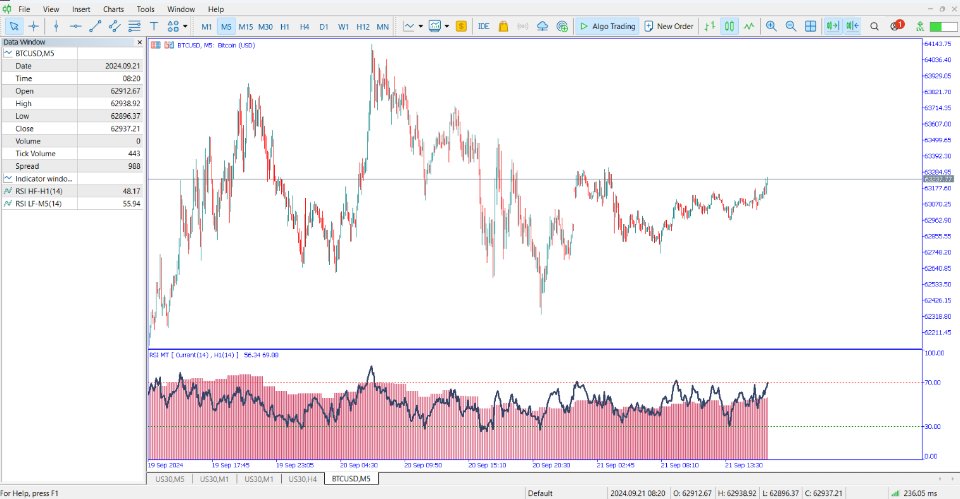
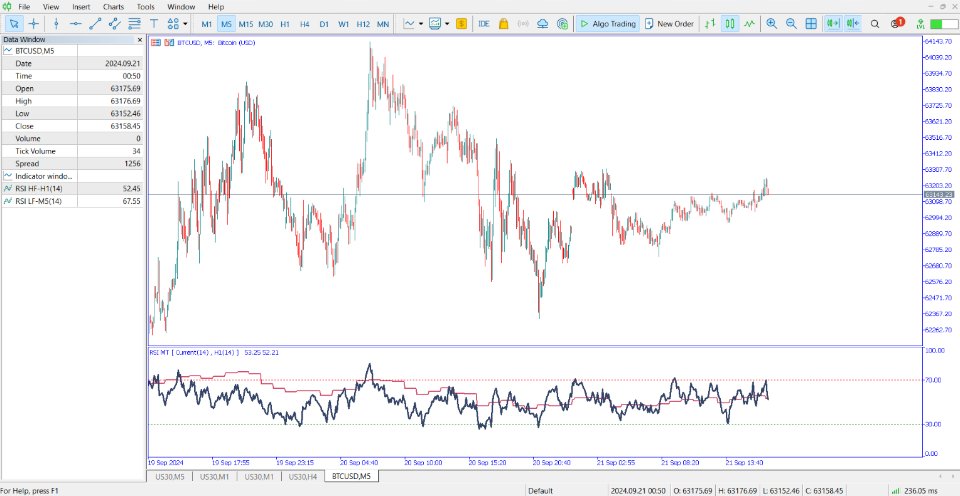
- Choose between a Histogram or Line type for the higher timeframe RSI, while the lower timeframe RSI is always displayed as a line.
- Select either both timeframes or just the higher timeframe to be displayed, depending on your strategy.
-
Configurable Alerts:
- Set overbought and oversold alerts with two modes:
- Single alert per candle in the selected timeframe.
- Single alert per candle in the current timeframe.
- Set overbought and oversold alerts with two modes:
-
Aesthetic Customization:
- Adjust the color and width of the RSI lines for both timeframes to suit your visual preferences and chart style.
Dual Time Frame RSI provides flexibility, alerts, and multi-timeframe insights, making it a powerful tool for traders who rely on RSI to make informed trading decisions.


